
Figures & data
Figure 1. Structure of the four natural estrogens, estrogen receptors (α and β) and ligand-binding domains. A: Structure of natural estrogens. E1 and E2: adult estrogens; E3 and E4: fetal estrogens. B: Estrogen receptors α and β (ERα and ERβ). Functional domains include the DNA-binding domain (DBD), ligand-binding domain (LBD), and two transcriptional activation functions, AF-1 and AF-2. The A/B domain, at the protein amino terminus (NH2), contains AF-1. The C domain binds to DNA motifs (consensus estrogen response elements [EREs]). The D domain (the hinge region) is involved in specific DNA binding and nuclear ER localization. The E domain is the LBD: it interacts with estrogens and selective estrogen receptor modulators (SERMs) and contains the AF-2 region. The carboxy terminus (COOH) is at the F domain. C&D: Ribbon diagrams. ERα-LBD structure complexed with estrogens (blue:E2; red:E3; green:E4). C: Ball-and-stick rendering of the ligand-binding site of the ligands and their interacting residues. Dotted lines: hydrogen bonds. D: LBDs depicted in C and the glucocorticoid receptor-interacting protein 1 (GRIP1) peptide fragment coactivator protein complexed with E3 or E4 only (darker red/green). Ligand: represented as space-filled model. Helix 12 position depicted by an arrow. Panel B adapted from Arnal JF, et al (2017) [Citation3], and panels C and D from Abot A, et al (2014) [Citation48].
![Figure 1. Structure of the four natural estrogens, estrogen receptors (α and β) and ligand-binding domains. A: Structure of natural estrogens. E1 and E2: adult estrogens; E3 and E4: fetal estrogens. B: Estrogen receptors α and β (ERα and ERβ). Functional domains include the DNA-binding domain (DBD), ligand-binding domain (LBD), and two transcriptional activation functions, AF-1 and AF-2. The A/B domain, at the protein amino terminus (NH2), contains AF-1. The C domain binds to DNA motifs (consensus estrogen response elements [EREs]). The D domain (the hinge region) is involved in specific DNA binding and nuclear ER localization. The E domain is the LBD: it interacts with estrogens and selective estrogen receptor modulators (SERMs) and contains the AF-2 region. The carboxy terminus (COOH) is at the F domain. C&D: Ribbon diagrams. ERα-LBD structure complexed with estrogens (blue:E2; red:E3; green:E4). C: Ball-and-stick rendering of the ligand-binding site of the ligands and their interacting residues. Dotted lines: hydrogen bonds. D: LBDs depicted in C and the glucocorticoid receptor-interacting protein 1 (GRIP1) peptide fragment coactivator protein complexed with E3 or E4 only (darker red/green). Ligand: represented as space-filled model. Helix 12 position depicted by an arrow. Panel B adapted from Arnal JF, et al (2017) [Citation3], and panels C and D from Abot A, et al (2014) [Citation48].](/cms/asset/93cece59-4bd5-4205-a703-14f369ab4441/ierj_a_2054413_f0001_oc.jpg)
Table 1. Clinical applications of E4
Figure 2. Comparison of E2- and E4-induced in vitro coregulator recruitment by ERα. Full-length estrogen receptor α (ERα) was stimulated with estradiol (E2) or estetrol (E4) and incubated with a set of 154 immobilized peptides representing coregulator-derived binding motifs; binding was detected using a fluorescently labeled ERα-antibody. The subset with ERα-interacting peptides is shown here. Each panel displays concentration-dependent (log(M), x-axis) modulation of ERα binding (arbitrary units’ fluorescence, y-axis) to a particular coregulator motif by E2 (red) or E4 (blue).
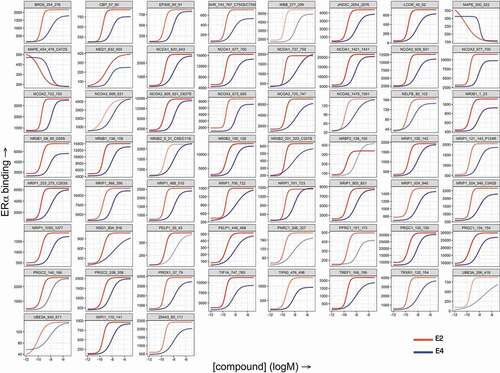
Figure 3. Effect of estetrol (E4) on hemostasis markers and sex hormone binding globulin (SHBG). A: Changes of hemostasis markers are significantly lower in the E4 15 mg/ drospirenone (DRSP) 3 mg group than in the ethinyl estradiol (EE)/DRSP group and always equivalent or lower than in the EE/levonorgestrel group. Columns represent median of percentage change from baseline to cycle 6. Parameters examined: PAI-1, plasminogen activator inhibitor type 1; SHBG, sex hormone-binding protein; t-PA, tissue plasminogen activator; TFPI, tissue factor pathway inhibitor; VWF, von Willebrand factor. B: nAPCsr is significantly lower in the E4/DRSP group than in the EE/LNG or EE/DRSP groups. C: Relative risk of venous thromboembolism (VTE RR) as a function of the change in normalized activated protein C sensitivity ratio (nAPCsr) during combined oral contraceptive (COC) use. * p < 0.05 vs baseline; # p < 0.05 vs E4/DRSP. Panel A and B: Published in Douxfils et al. 2020 [Citation84]. Permission to use granted. Panel C: In silico-modeling based on the Cochrane network meta-analysis of de Bastos M. et al. Cochrane Database Syst Rev. 2014 published in Morimont, L., Dogné J-M., and Douxfils J. Permission to use granted [Citation90].
![Figure 3. Effect of estetrol (E4) on hemostasis markers and sex hormone binding globulin (SHBG). A: Changes of hemostasis markers are significantly lower in the E4 15 mg/ drospirenone (DRSP) 3 mg group than in the ethinyl estradiol (EE)/DRSP group and always equivalent or lower than in the EE/levonorgestrel group. Columns represent median of percentage change from baseline to cycle 6. Parameters examined: PAI-1, plasminogen activator inhibitor type 1; SHBG, sex hormone-binding protein; t-PA, tissue plasminogen activator; TFPI, tissue factor pathway inhibitor; VWF, von Willebrand factor. B: nAPCsr is significantly lower in the E4/DRSP group than in the EE/LNG or EE/DRSP groups. C: Relative risk of venous thromboembolism (VTE RR) as a function of the change in normalized activated protein C sensitivity ratio (nAPCsr) during combined oral contraceptive (COC) use. * p < 0.05 vs baseline; # p < 0.05 vs E4/DRSP. Panel A and B: Published in Douxfils et al. 2020 [Citation84]. Permission to use granted. Panel C: In silico-modeling based on the Cochrane network meta-analysis of de Bastos M. et al. Cochrane Database Syst Rev. 2014 published in Morimont, L., Dogné J-M., and Douxfils J. Permission to use granted [Citation90].](/cms/asset/84ec3f9f-1c0c-41e8-a78b-23027cebe154/ierj_a_2054413_f0003_oc.jpg)
Table 2. Phase 3 studies evaluating the E4 15 mg/DRSP 3 mg COC (24 active/4 inactive regimen)