Figures & data
Figure 1. Flowchart of exclusion and inclusion criteria.
Table 1. Selected cohort characteristics of women among the exposure groups. Lombardy Region, Italy, 2007–2017.
Figure 2. Forest plot of the risk ratio for the association between antihypertensive treatment and maternal and neonatal outcomes, unadjusted and propensity score stratified adjusted analyses. Lombardy Region, Italy, 2007–2017.
Table 2. Adjusted relative risk of neonatal outcome among women without pregnancy hypertensive disorders. Lombardy, Italy, 2007–2017 (N = 4689).
Table 3. Adjusted relative risk of maternal and neonatal outcome among recommended drug classes. Lombardy, Italy, 2007–2017.
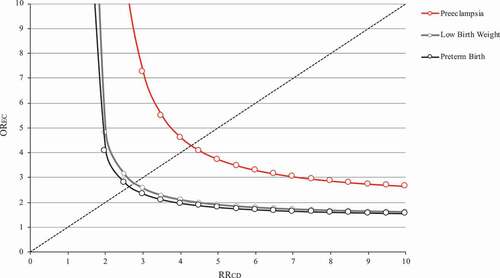
Figure 3. Influence of an unmeasured confounder on the relationship between use of antihypertensive treatment during the first 20 weeks of gestation, with respect to no-use, and the risk of preeclampsia, low birth weight, and preterm birth. The graph indicates the combinations of confounder‐outcome (RRCD) and exposure‐confounder (OREC) associations that would be required to move the observed effect of antihypertensive treatment toward the null. Lombardy Region, Italy, 2007–2017.