
Figures & data
Figure 1. Distribution of factors for patients who were adherent and non-adherent to ophthalmic drugs.
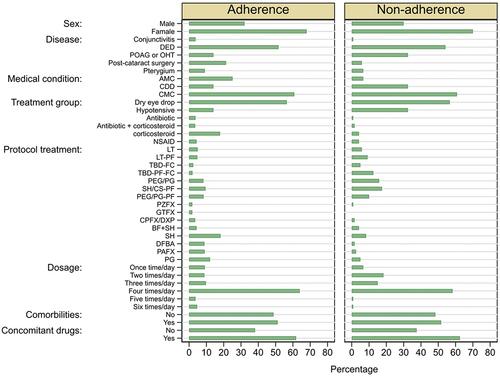
Table 1. Baseline characteristics.
Figure 2. Polychoric correlation matrix for all study factors. NA= not available.
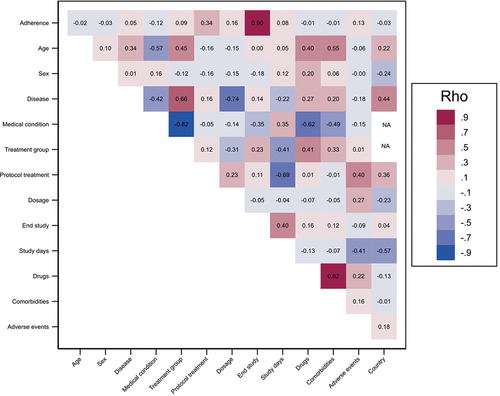
Figure 3. Factors significantly associated with adherence to ophthalmic drugs. *p < 0.05, **p < 0.01, ***p < 0.001; horizontal lines: 95% CI; vertical line: OR = 1 (no effect).
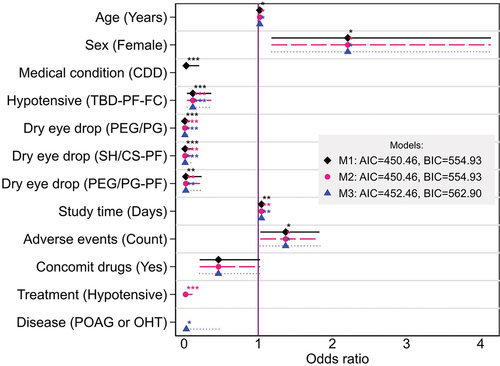
Table 2. Metrics for evaluate the LR models performance considering class imbalanced.
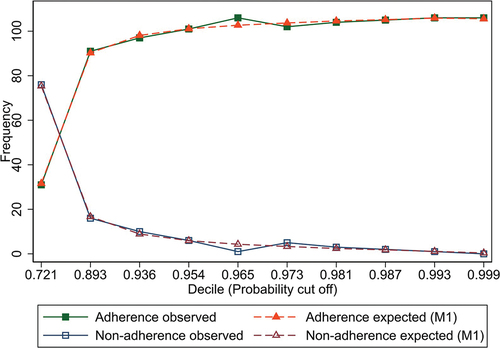
Figure 4. The observed and expected adherence/non-adherence for model 1 (M1).
Supplemental material
Supplemental Material
Download MS Word (124.5 KB)Data availability statement
The dataset analyzed for this study can be found in the Open Science Framework repository (https://osf.io) as DOI 10.17605/OSF.IO/2WJKV.