Figures & data
Figure 1. Behavioral item. Headlines were displayed with an image similar to what one would see on their social media feed. The order of the four articles displayed was randomized between participants.

Table 1. Results from the logistic regression predicting the probability that individuals selected the environmental article over the other articles. Coefficients are not standardized.
Figure 2. Three-way interaction effect between story (C: climate change vs P: pollution), headline format (Q: question vs. T: traditional), and generation (Millennial vs. Older adults). The earthquakes story and the forward-referencing headline conditions were removed to simplify the image.
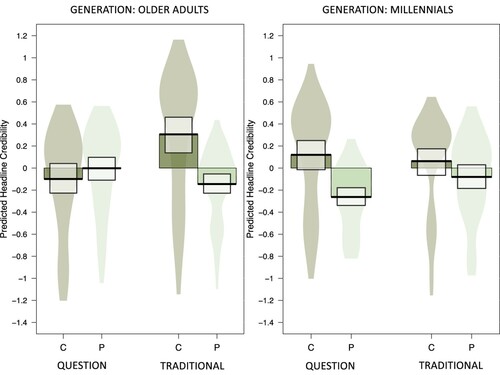
Table 2. Results from the regressions predicting headline credibility ratings score, expectations for story credibility, and hypothetical engagement scores.
Figure 3. Predicted probability of categorizing the stories as real news (as opposed to fake news, satire, or other) based on the format of the headline averaged across other variables. Black bar represents the mean, and the white boxes are Bayesian highest density intervals.
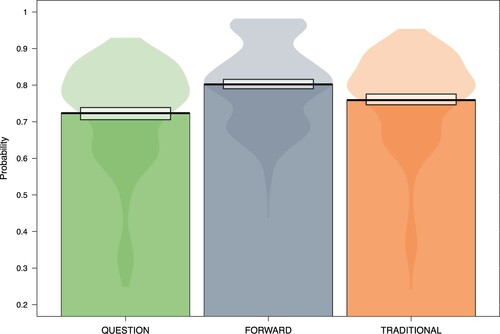
Figure 4. Interaction effect between story topic and political party affiliation. Democrats (D) were more likely than Republicans (R), generally, to categorize a story as real news. However, the difference was most drastic for the climate change story.
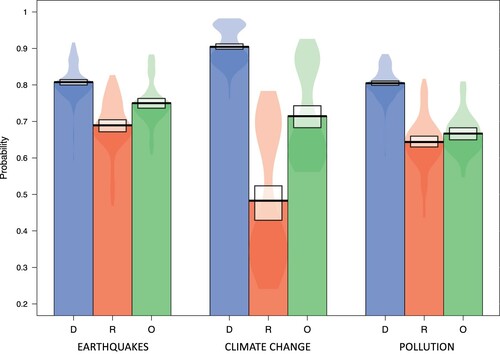
Figure 5. Story topic by headline format interaction. Whereas traditionally-formatted headlines are rated similarly as forward-referencing headlines for the earthquake and pollution stories, they are seen as slightly different (with forward-referencing headlines leading participants to expect a story to be more credible) for the climate change story.
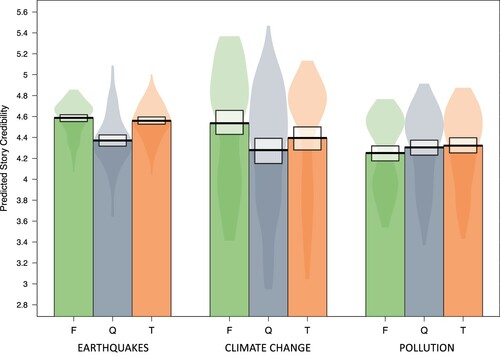
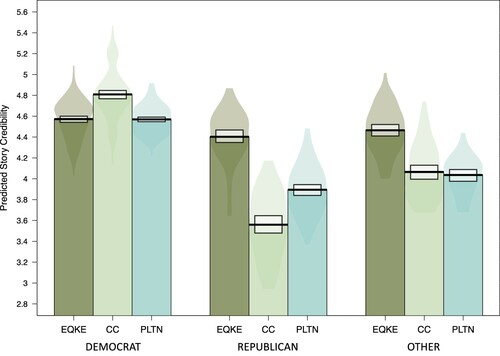
Figure 6. Story topic by political party affiliation interaction. This interaction effect is likely driven by the differences in views about climate change from the different political parties.