Figures & data
Table 1. Overview of Represented News Outlets in the Survey per Country (if indicated).
Figure 1. Distribution of the professional role descriptions (N = 42).
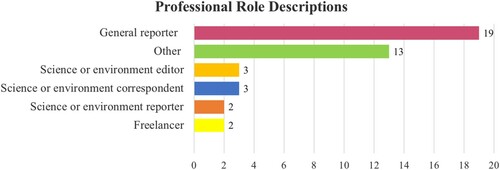
Figure 2. Answers to the question: “How did you find out about the WWA reports (France, Europe)? You can choose more than one option.” (n = 15).
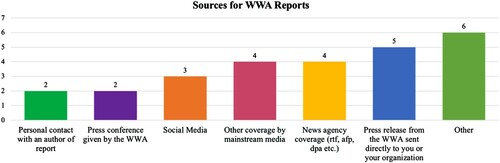
Figure 3. Reporting about the link between heatwaves and climate change—difference between general heatwaves and 2019 heatwaves across countries (n=31); means are reported (1 = not at all important, 5 = extremely important).
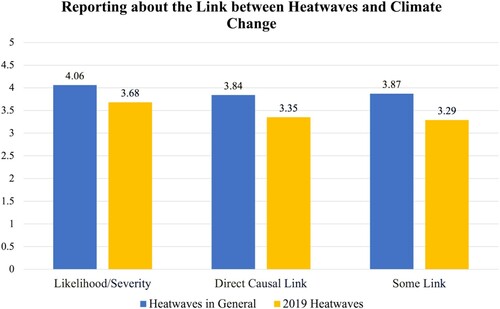
Figure 4. Reporting about the link between heatwaves and climate change in general—differences across countries (n=31); means are reported (1 = not at all important, 5 = extremely important).
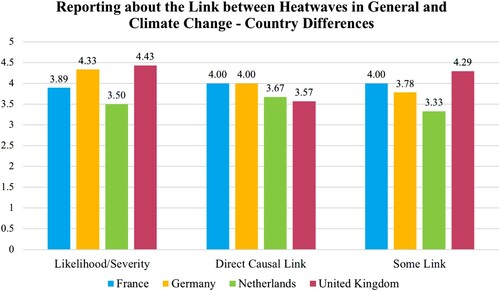
Figure 5. Sources journalists use to write about the 2019 heatwave’s connections with climate change (n = 36); multiple answers were possible.
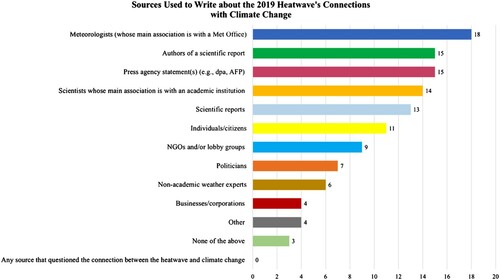
Figure 6. Aspects considered important to include in the 2019 heatwave coverage (n = 39); means are reported.
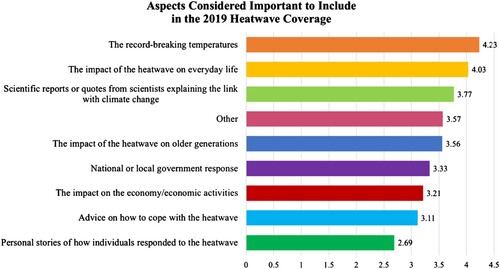
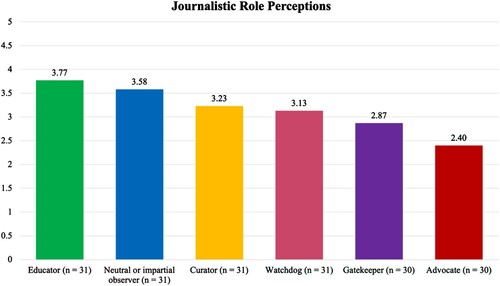
Figure 7. Journalistic role perceptions when writing about extreme weather events; mean values are shown (1= not at all, 5 = extremely).