
Figures & data
Table 1. Interviewees’ experience and background.
Table 2. Survey respondents demographics and breakdown of self-assessment of how informed participants rated themselves (on a 10-point scale).
Figure 1. The four developed prototypes of online news storytelling.
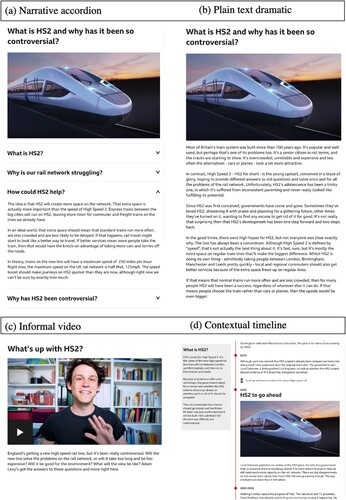
Table 3. Breakdown of how long readers took over each prototype.
Table 4. The “value added” provided by each prototype.
Table 5. Summary of participants impressions about the prototypes and numerical synthesis of the findings.
Table 6. Comparing the prototypes with traditional news.