
Figures & data
Figure 1. Net profits on sales and gross advertising revenues of analysed newspapers across three time periods.
aAuthors own elaboration based on data from the Czech Audit Bureau of Circulations. Net profit for each month was computed as follows: average circulation per issue * selling price per issue at given time * the number of issues per month—VAT at given time—distributors’ margin (33%). Monthly net profits for given time period were then summarized. b Data on gross advertising revenues were provided and aggregated by Czech Publishers´ Association.
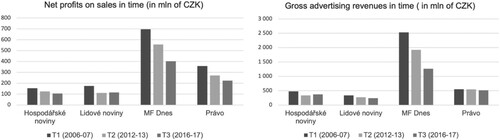
Figure 2. Percentage of people over the age of 16 using the internet to read news, newspapers and magazines.
Note. Based on secondary data from Czech Statistical Office (Citation2023, 26).
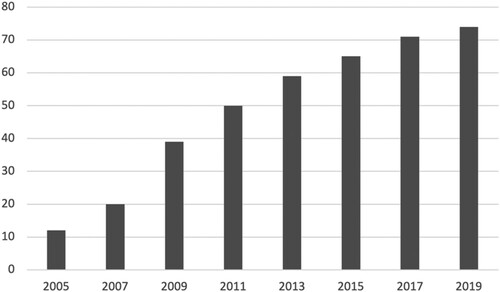
Table 1. Owner, ownership type and average circulation for analysed newspapers across time periods.
Table 2. The presence of infotainment, service and civic role and their individual indicators per time period.
Table 3. Within-newspaper between-time-period breakdown of articles containing at least one indicator of audience-related roles.
Table 4. Bivariate relationships between the independent variables and the presence of infotainment, service and civic role in news stories.
Table 5. Estimates of regression coefficients of ridge logistic regression model of the presence of infotainment role.
Table 6. Estimates of regression coefficients for ridge logistic regression model for the presence of service role the news.
Table 7. Estimates of regression coefficients for ridge logistic regression model of the presence of civic role in news.
Supplemental Material
Download MS Word (43.2 KB)Data Availability Statement
The data that support the findings of this study are available from the author upon reasonable request.