Figures & data
Figure 1. The quadratic Mandelbrot set together with nearby regions of the complex plane (left) and an enlargement of its upper-right flank (right).
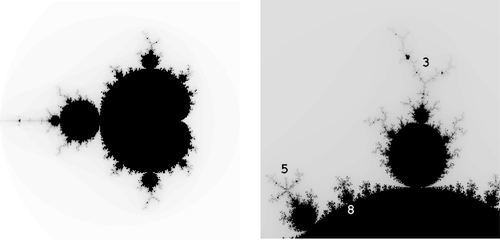
Figure 2. A view of the cubic Mandelbrot set and the surrounding areas of the complex plane.
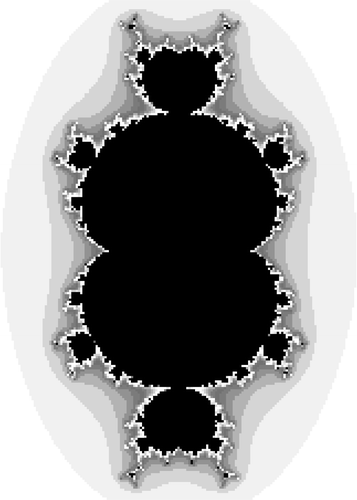
Table 1. Desired divergence values for the first mask, the mask derived from equation (Equation1)
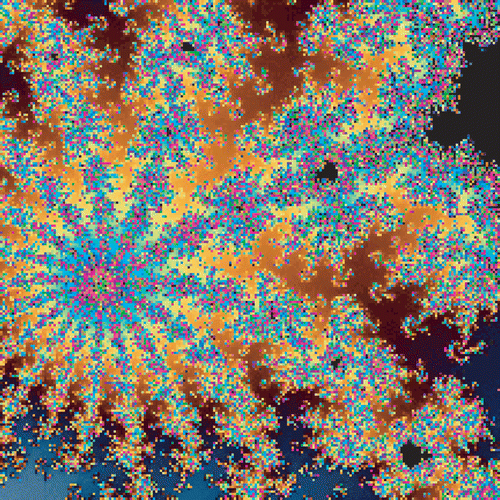
Figure 3. A spiral view and a starburst view selected from the quadratic Mandelbrot set. These views are used to generate induced masks.

Figure 4. The 20 best-of-run views of the quadratic Mandelbrot set (upper) and the cubic Mandelbrot set (lower) found using a fitness function incorporating the first designed mask.
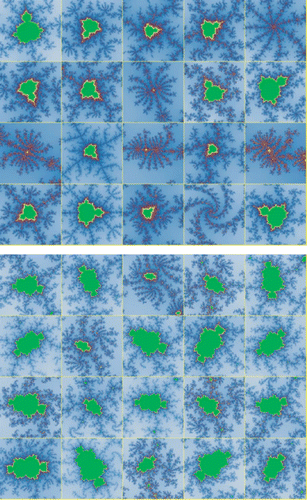
Figure 5. The 20 best-of-run views of the quadratic Mandelbrot set found using a fitness function incorporating the second designed mask. See insert for colour version of this figure.
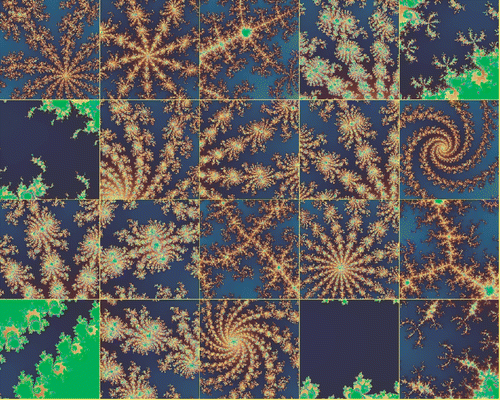
Figure 6. The 19 best-of-run views of the quadratic Mandelbrot set using a fitness function derived from the spiral view. The spiral is displayed as the first image. The upper set of images uses a 21 × 21 grid while the lower uses 31 × 31.
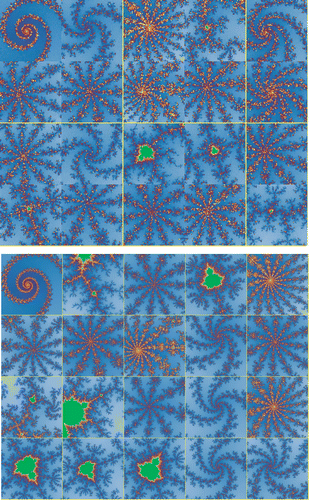
Figure 7. The 19 best-of-run views of the quadratic Mandelbrot set found using a fitness function derived from the starburst image. The starburst itself is displayed as the first image in the set. These images use a 31 × 31 sample grid.
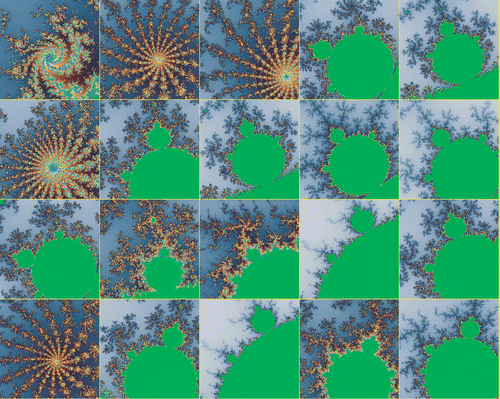
Figure 8. Squares in inverted grey scale above show the locations of views found by the evolutionary algorithm using the first mask on the quadratic Mandelbrot set. The squares shown above are substantially larger than the actual views; all views are smaller than single pixels at this scale.
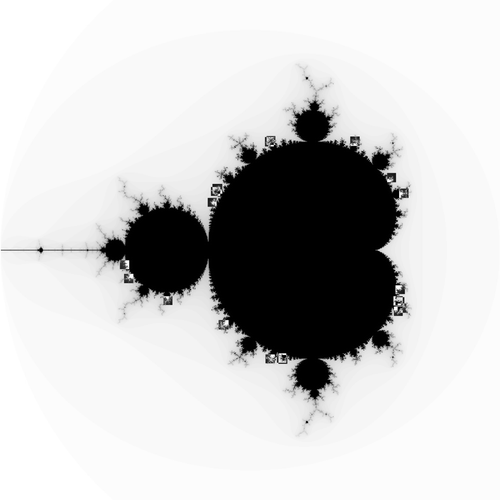
Figure 9. A view located with an alternate fitness function that failed to find a diversity of visual characteristics.