
Figures & data
Table 1. Frequency of words counts in Frank Sinatra's lyrics.
Figure 1. Left: The solid dots depict the values of the empirical estimator of the counts of verbs occurring in the gathered lyrics of Frank Sinatra. Right: Histogram of the bootstrapped Euclidean distance between the empirical and complete monotone estimators based on the verb counts. The dashed line corresponds to the 95%-quantile of the bootstrapped distances , while the solid line corresponds the observed distance
. See text for more details.
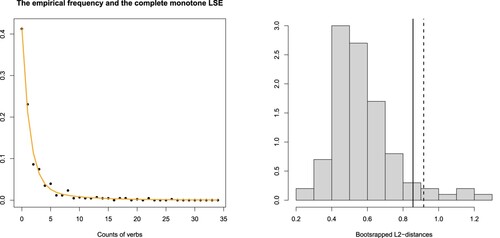
Table 2. The support points and weights of the fitted complete monotone LSE to the verb counts.