Figures & data
Figure 1. Static network models of dynamic networks. (a)–(d) are sequential ‘snapshots’ of a dynamic network of contacts (lines) between individuals (circles). (e) A static network representation of the network, where edges denote the existence of a contact in the dynamic network. (f) A weighted network representation, where the edge weights (line thickness) indicate the number of times any two individuals are in contact. (g) Another weighted network representation, where weights represent the number of consecutive times any two individuals are in contact.
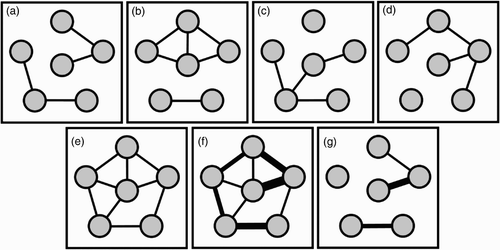
Figure 2. Classes of network dynamics. Extrinsic changes: (a) Births add new nodes and edges to a network and deaths remove them, while migration events can add and remove nodes and edges; (b) changes in social behaviour or seasonal patterns in mixing can add or remove edges, or rewire existing edges. Pathogen-mediated changes: (c) if infection confers subsequent immunity, recovered and immune individuals are removed from the epidemiologically active portion of the network; (d) when individuals withdraw from social interaction due to infection, their contacts (edges) decrease. Public health-mediated changes: (e) vaccination removes nodes and their connecting edges from the population; (f) avoidance of infected individuals may reduce contacts or replace contacts to infected nodes with contacts to susceptible nodes; (g) while school or workplace closures directly reduce contacts that would have otherwise occurred, they may inadvertently decrease social distances by causing new contacts to form elsewhere.
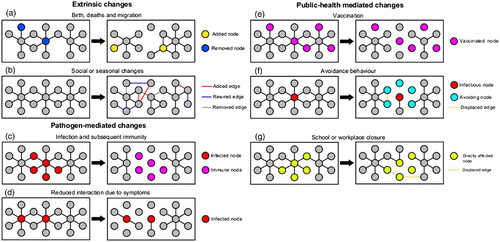
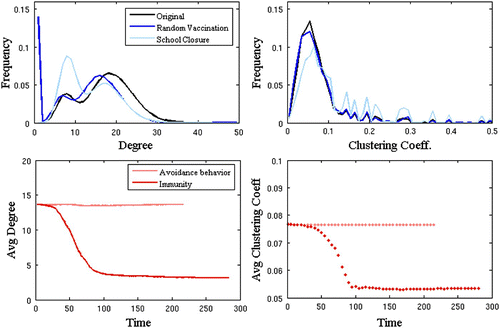
Figure 3. The topological impact of various dynamic processes in an urban contact network. We measure structural impact in terms of node degree (i.e. number of edges) (left panels) and clustering coefficient (i.e. the propensity of triangles, measured as the fraction of triples for a node that are closed) (right panels) across the network. In the top panels, we compare random vaccination and school closure. In the bottom panels, we compare infection-acquired immunity (a pathogen-mediated change) to avoidance-behaviour (a public-health measure).