Figures & data
Figure 1. Phase plan of the systems Equation(2) and Equation(3)
. The solution is zero out of the stared characteristics coming from points of the boundary (1, θ) with θ∈[θ0−ϵ, θ0+ϵ]. The values of the parameters are chosen for illustrative purposes and are not realistic ones: a=2, c=5.85, d=0.1, θ0=200, ϵ=100.
![Figure 1. Phase plan of the systems Equation(2) and Equation(3). The solution is zero out of the stared characteristics coming from points of the boundary (1, θ) with θ∈[θ0−ϵ, θ0+ϵ]. The values of the parameters are chosen for illustrative purposes and are not realistic ones: a=2, c=5.85, d=0.1, θ0=200, ϵ=100.](/cms/asset/db098b77-ae9e-4de4-a3e9-94edf67d81e3/tjbd_a_568071_o_f0001g.jpg)
Figure 2. Convergence of the numerical scheme for the 2D model (problem (1)), with ϵ=100. The values of the parameters for the growth velocity field G are from [11] and correspond to mice data: a=0.192, c=5.85, d=0.00873, θ 0=625. For the metastasis parameters, we used: m=0.001 and α=2/3. Total simulation time T=50. (a) Relative error in function of M, for various timesteps dt. (b) Relative error in function of dt, for various values of the discretization parameter of the boundary M.
![Figure 2. Convergence of the numerical scheme for the 2D model (problem (1)), with ϵ=100. The values of the parameters for the growth velocity field G are from [11] and correspond to mice data: a=0.192, c=5.85, d=0.00873, θ 0=625. For the metastasis parameters, we used: m=0.001 and α=2/3. Total simulation time T=50. (a) Relative error in function of M, for various timesteps dt. (b) Relative error in function of dt, for various values of the discretization parameter of the boundary M.](/cms/asset/02d11529-9abb-4147-af07-c05f85460cad/tjbd_a_568071_o_f0002g.jpg)
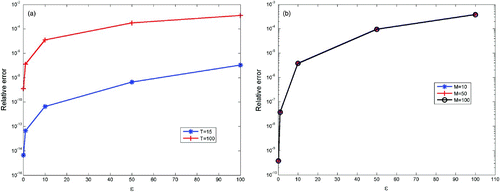
Figure 3. Relative difference between the 1D simulation and the 2D one, for 5 values of ϵ: 100, 50, 10, 1 and 0.1. The values of the parameters are the same than in and the timestep used is dt=0.1. (a) Convergence when ϵ goes to zero, for T=15 and T=100. The value of M used for the 2D simulations is M=10. (b) Convergence when ϵ goes to zero, with respect to M (M=10, 50, 100), for T=50. The three curves are almost all the same.