Figures & data
Figure 1. A schematic representation of the SIRSP model. Solid and dashed lines indicate the dynamics of host and FLP, respectively.
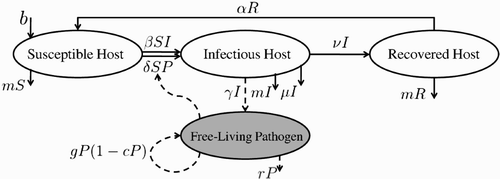
Table 1. Variables and parameters with units for the SIRSP model.
Figure 2. A conceptual representation of the secondary FLP and infectious hosts generated in the cycle of disease transmission. Here, H 0 and H 1 are the initial and secondary infectious host, respectively, while P 0 and P 1 are the initial and secondary FLP.
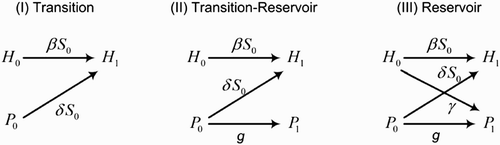
Table 2. Model parameters values related to salmonellosis in a dairy herd.
Table 3. Model parameters and values related to cholera in humans.
Figure 3. Using the parameter values indicated in and , dynamics of salmonellosis and cholera are numerically simulated. (a) Salmonella infection tends to an EE after the first epidemic wave. (b) Considering the infectious host and environment as generators of salmonellosis, the former corresponds to a force significantly higher than the latter. This is in agreement with . (c) After several epidemic waves, cholera becomes endemic and remains persistent in the host population and the environment. (d) Based on the parameter values, the direct and indirect infection forces play almost equal roles in generation of cholera infection.
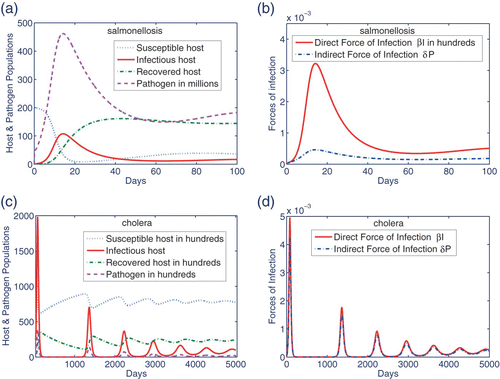
Figure 4. The top and bottom plots represent, respectively, changes in reproduction numbers for the salmonellosis and cholera parameters. Changes in the parameter values of (a) 1/ν, (b) γ, (c) β and (d) δ may result in substantially different ℛ0 values.
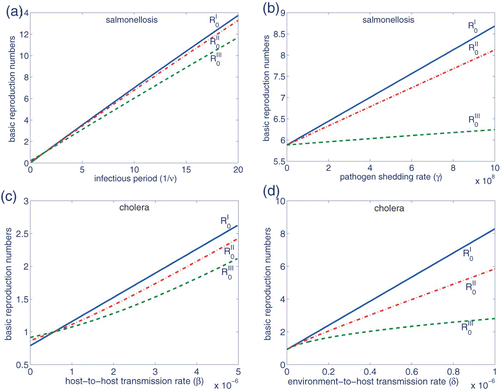
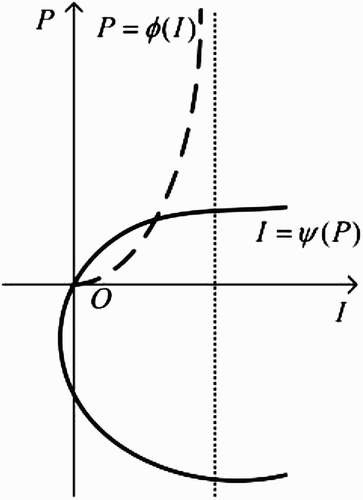
Figure A1 The graphs of functions P=φ(I) and I=ψ(P) for r>g.