Figures & data
Figure 1. Flow chart illustrating model Equation(2). All rates given are per capita except birth rates. For space constraints, the notation C
j
=[c
hj
(Q)+ρ
j
E
h(Q)]I
vj
/N
v (j=1, 2) is used.
![Figure 1. Flow chart illustrating model Equation(2). All rates given are per capita except birth rates. For space constraints, the notation C j =[c hj (Q)+ρ j E h(Q)]I vj /N v (j=1, 2) is used.](/cms/asset/4af5f18e-fd41-4eb2-a5c1-8732d803022e/tjbd_a_710339_o_f0001g.gif)
Table 1. Variables and notation for sylvatic T. cruzi transmission model.
Table 2. Parameter definitions and estimates (from Citation23 and Appendix 1) for sylvatic T. cruzi cycles involving raccoons and T. sanguisuga (R/S), woodrats and T. gerstaeckeri (W/G).
Figure 2. Weak, neutral, and strong trade-offs between two specialties as described by the symmetric function y=g(x)=(1−x 1/α)α, with α=½, 1, and 2, respectively.
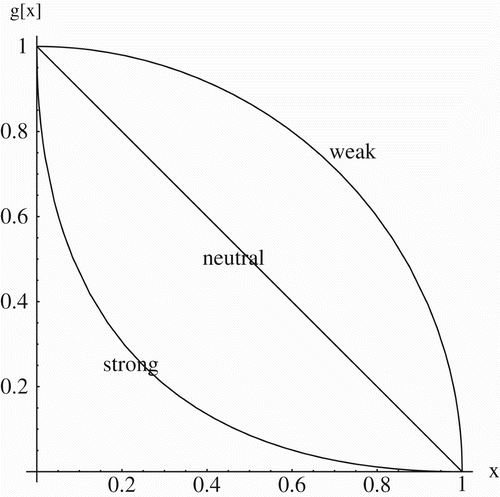
Figure 3. Competition between two strains with adaptation coordinates (x 1, y 1) and (x 2, y 2) can be studied through pairwise invasibility plots using either x 1 and x 2 or Δ1 and Δ2, where Δ=x−y. Here x 1>x 2.
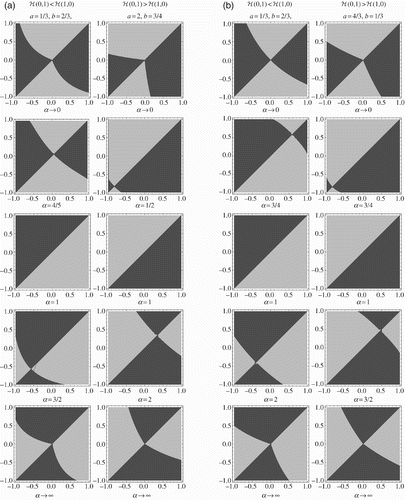
Figure 4. Competition outcomes (a) without, and (b) with, AOT in terms of the Δ1−Δ2 plane, with ℋ(0, 1)<ℋ(1, 0) in the left column and ℋ(0, 1)>ℋ(1, 0) in the right column, as the strength α of the trade-off varies from weak (top) to strong (bottom). Strain 1 wins in lighter shaded areas, strain 2 in darker ones.