Figures & data
Table 1. List of parameters.
Table 2. Values of the within-host and epidemiological parameters.
Figure 1. Epidemiological reproduction number vs. the infection rate of blood T cells β and the viral clearance rate δ.
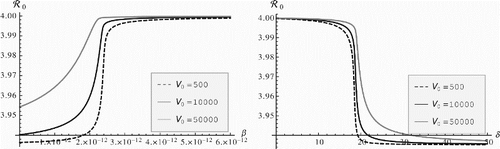
Figure 2. Epidemiological reproduction number vs. the shedding rate.
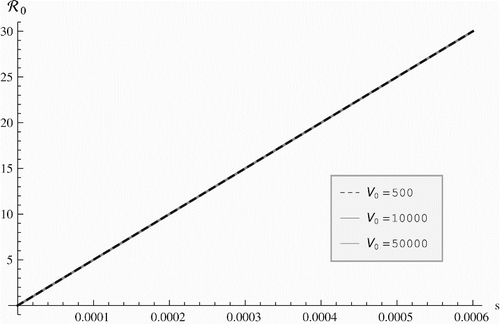
Figure 3. HIV prevalence vs. the infection rate of blood T cells β. HIV prevalence decreases with increased infection rate and viral load.
Figure 4. Magnitude of the elasticities of ℛ0 (left figure) and prevalence I1 (right figure) with respect to within-host infection parameters. The elasticities are plotted as a function of the initial viral load V0 and are colour-coded. Red, pink colours correspond to positive values, black and blue to negative values.
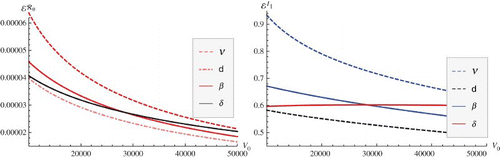
Figure 5. Plots of the invasion reproduction number (left figure) and the invasion reproduction number
(right figure) with respect to within-host reproduction number of strain two ℝ2. Several variants of the invasion reproduction numbers are plotted for different values of the initial viral load of strain two V02. Here, η1=0.1 and η2=0.005.
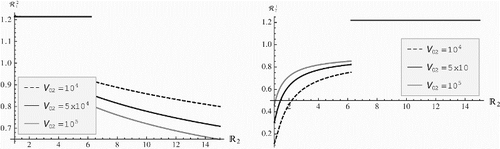
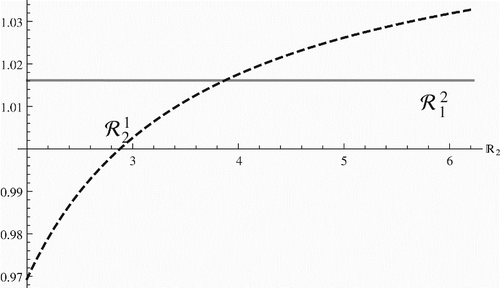
Figure 6. Plots of the invasion reproduction number and the invasion reproduction number
with respect to within-host reproduction number of strain two ℝ2 when ℝ2<ℝ1. Here, η1=0.02 and η2=0.027. It is clear that for ℝ2>3 both invasion numbers are above one.