Figures & data
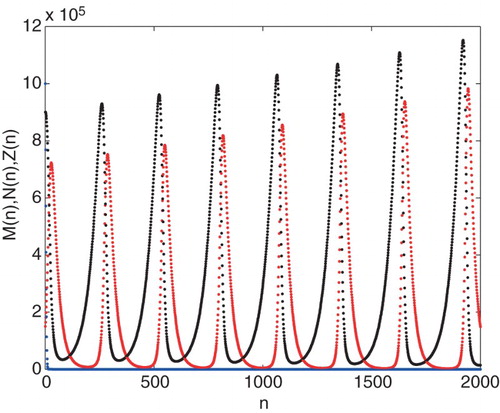
Figure 1. Graph of the iteration solution of ,
and
,where
.
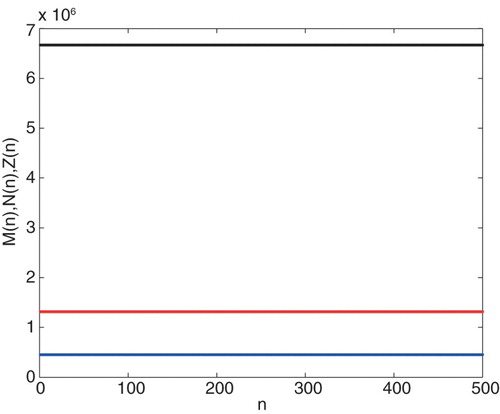
Figure 2. Graph of the iteration solution of ,
and
, where
. Parameter values are taken Example 2.3.
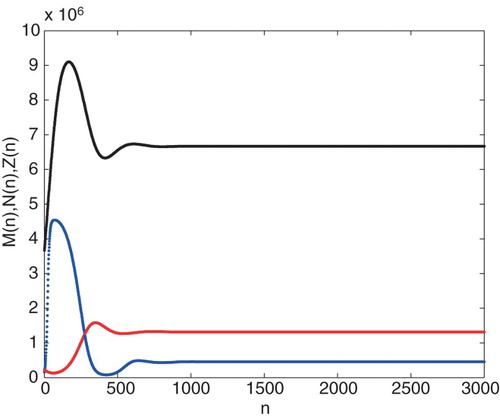
Figure 3. Graph of the . Parameter set is taken from Example 2.3.
Figure 4. Graph of Neimark-Sacker bifurcation of system (Equation7(7)
(7) ) for
, where
,
,
. The other parameters are taken Example 2.3.
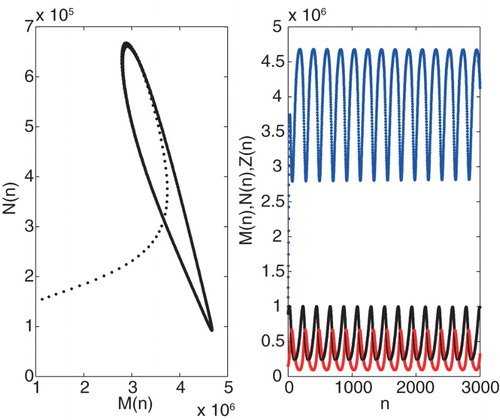
Figure 5. Graph of iteration solution of the system for . The other parameters and initial conditions are the same as Figure .
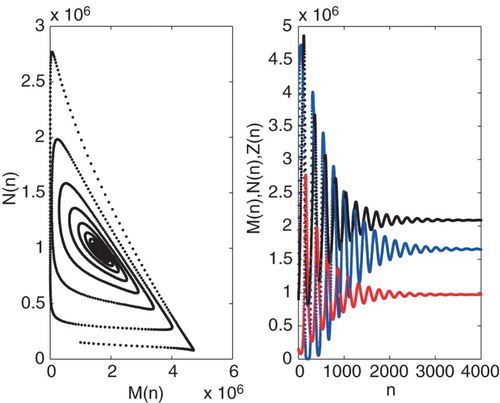
Figure 6. Graph of iteration solution of the system for . The other parameters and initial conditions are the same as Figure .
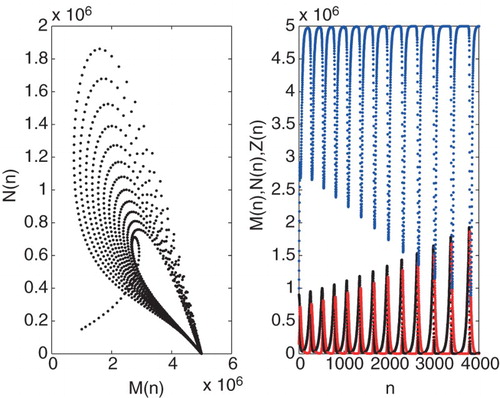
Figure 7. Graph of the iteration solution of ,
and
, where
. The other parameters are the same as Figure .