Figures & data
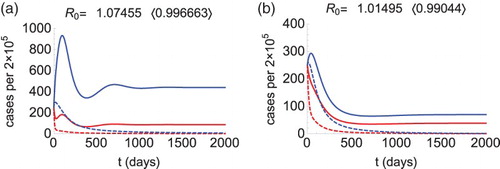
Figure 1. Morbidity curves of patch 1 (red) and patch 2 (blue), without control (solid curves) and with control (dashed curves). We let (
),
,
, and
for (a) and
for (b). Other parameters are as described in the text. Figure (a): When
, then
(solid curves), the condition (Equation2
(1)
(1) ) is satisfied (
), so we calculate
and
. Choosing
(dashed curves), the reproduction number drops below 1 (see in the bracket) and the outbreak is prevented. Figure (b): When
, then
(solid curves), the condition (Equation4
(3)
(3) ) is satisfied (
), so we calculate
and
,
. Choosing
and
(dashed curves), the reproduction number drops below 1 (see in the bracket) and the outbreak is prevented.
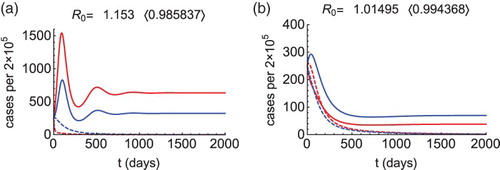
Figure 2. Morbidity curves of patch 1 (red) and patch 2 (blue), without control (solid curves) and with control (dashed curves). We let (
),
,
,
. Other parameters are as described in the text. These parameters make
(solid curves). Figure (a): The condition (Equation4
(3)
(3) ) is satisfied (
), so we calculate
, and
,
. Choosing
and
(dashed curves), the reproduction number drops below 1 (see in the bracket) and the outbreak is prevented. Figure (b): The condition (Equation5
(4)
(4) ) is satisfied (
), so we calculate
, and
. Choosing
(dashed curves), the reproduction number drops below 1 (see in the bracket) and the outbreak is prevented.