Figures & data
Figure 1. Flow chart of model (Equation1(1)
(1) ).
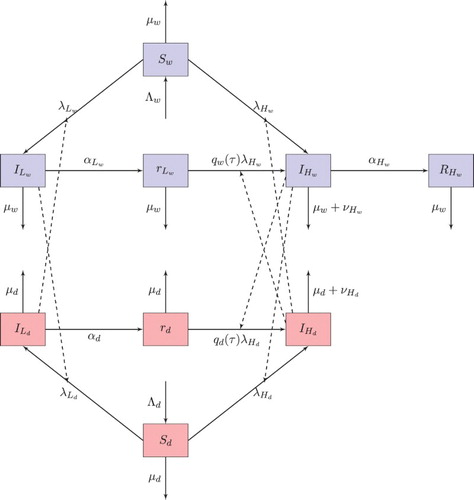
Table 1. Definition of the variables of model (Equation1 (1) (1) ).
Table 2. Definition of the parameters of model (Equation1(1) (1) ).
Table 3. Parameter ranges.
Table 4. Source-sink status of birds to AI viruses.
Figure 2. Coexistence with realistic parameter values. The parameter values used in the figure are as follows: ,
,
,
,
,
,
,
,
,
,
,
,
,
,
,
,
,
,
. The reproduction numbers are
and
. The invasion coefficients are as follows:
and
. The red line shows HPAI in wild birds, the orange dashed line shows HPAI in domestic birds, the blue line shows LPAI in wild birds, the green dashed line shows LPAI in domestic birds.
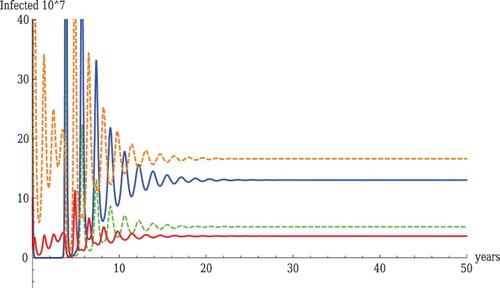
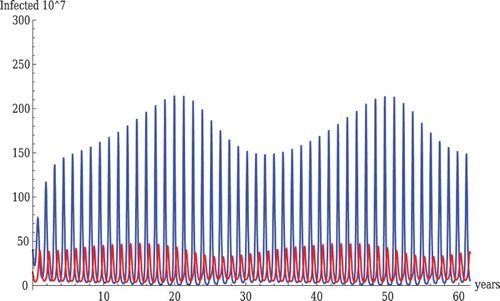
Figure 3. Oscillations with realistic parameter values. The parameter values used in the figure are as follows: ,
,
,
,
,
,
,
,
,
,
,
,
,
,
,
,
,
,
. The reproduction numbers are
and
. The invasion coefficients are as follows:
and
. The red line shows HPAI in wild birds, the orange dashed line shows HPAI in domestic birds, the blue line shows LPAI in wild birds, the green dashed line shows LPAI in domestic birds.
Figure 4. Coexistence with realistic parameter values. The parameter values used in the figure are as follows: ,
,
,
,
,
,
,
,
,
,
,
,
,
,
,
,
,
,
. The reproduction numbers are
and
. The invasion coefficients are as follows:
and
. The red line shows HPAI in wild birds, the orange dashed line shows HPAI in domestic birds, the blue line shows LPAI in wild birds, the green dashed line shows LPAI in domestic birds.
Table
Figure 5. Sustained oscillations in the wild birds only system. Parameter values are ,
,
,
,
,
,
,
,
,
,
,
,
. The reproduction numbers are
and
. The invasion coefficients are
and
. The red line shows HPAI and the blue line shows LPAI.
Figure 6. Sustained oscillations in the wild birds only system. Parameter values are ,
,
,
,
,
,
,
,
,
,
,
,
. The reproduction numbers are
and
. The invasion coefficients are
and
. The red line shows HPAI and the blue line shows LPAI.