Figures & data
Figure 1. Transfer diagram of the model (Equation1(1)
(1) ).
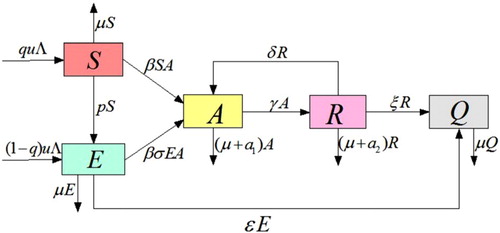
Figure 2. When , the alcohol-free equilibrium
is globally asymptotically stable.
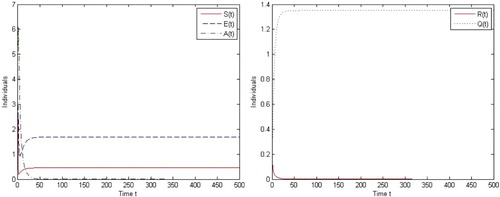
Figure 3. When , the alcohol-free equilibrium
is globally asymptotically stable.
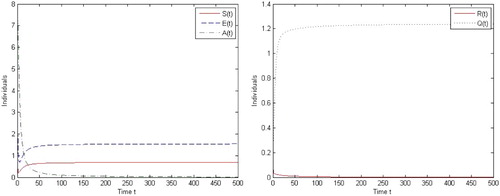
Figure 4. When , the alcohol present equilibrium
is globally asymptotically stable.
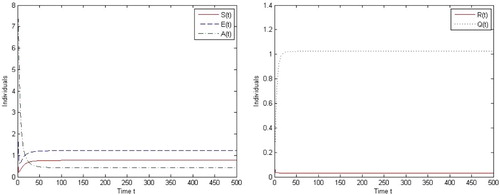
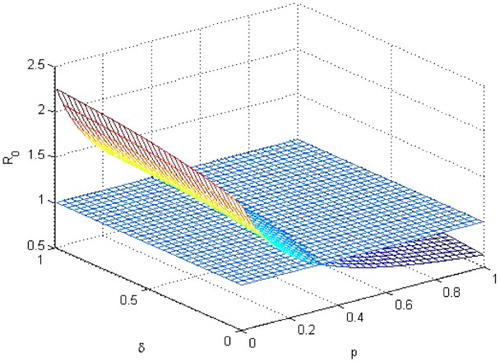
Figure 5. The relationship among , p, δ.