Figures & data
Table 1. Description and values of parameters of the model.
Figure 1. Effect of the survival periods, τ, for the model with delay in death occurrence. (a) Susceptible people (b) Proportion of infected people in the primary stage, (c) Proportion of infected people in the asymptomatic stage,
(d) AIDS mortality rates and (e) Total population. Parameters:
,
,
,
,
year−1, and
year−1.
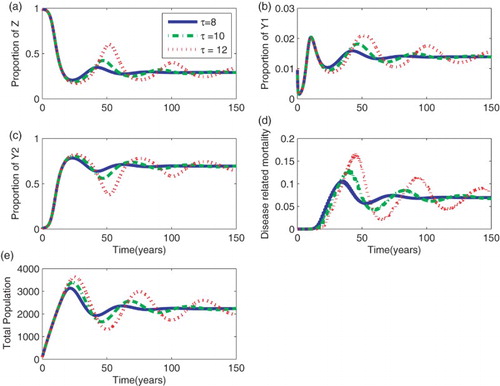
Figure 2. Effect of the death rate, γ, for the model without delay in the occurrence of deaths. (a) Susceptible people (b) Proportion of infected people in the primary stage, (c) Proportion of infected people in the asymptomatic stage,
(d) AIDS mortality rates and (e) Total population. Parameters:
,
,
,
, and
year−1.
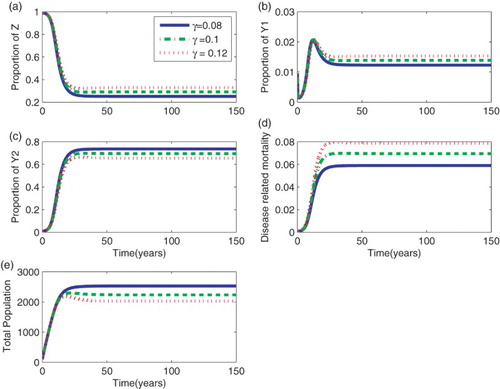
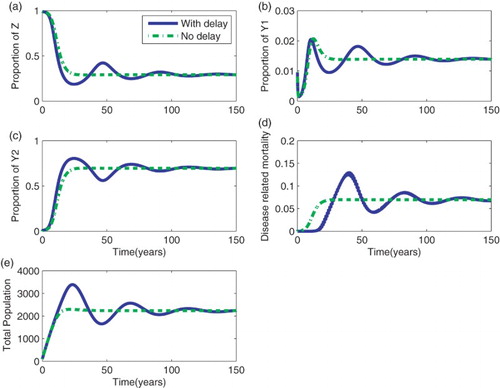
Figure 3. A comparison between the model with and without delay. (a) Susceptible people (b) Proportion of infected people in the primary stage, (c) Proportion of infected people in the asymptomatic stage,
(d) AIDS mortality rates and (e) Total population. Parameters:
,
,
,
,
year−1,
, and
.