Figures & data
Figure 1. The existence of the endemic equilibria of model (Equation3(3)
(3) ) in the case of p>1. There are equilibria
and
on the curve
,
and
on
, three equilibria
,
and
in the region
, a unique equilibrium
in the region
, a unique equilibrium
in the region
, and no endemic equilibrium in
. See the content for the definitions of these regions.
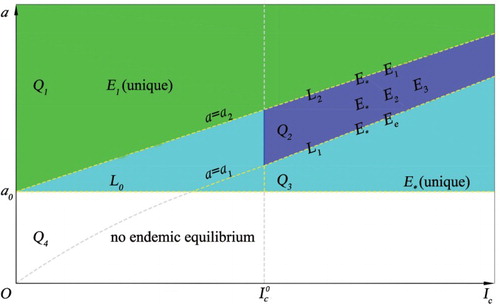
Figure 2. Phase plot of I verses S showing that two stable endemic equilibria ,
coexist. Here, we fix
, and set
.
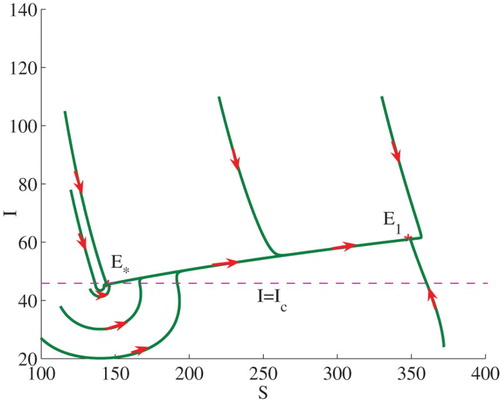
Figure 3. Phase plot of I verses S showing that bi-stability occurs for and
. Here,
and
are locally stable while
is a saddle point.
and other parameters take the same values as in Figure .
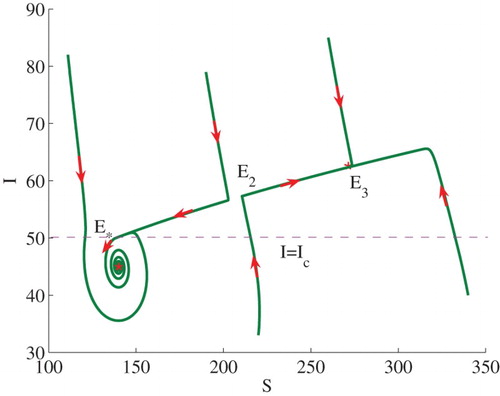
Figure 4. A limit cycle intersects with the line at
and
.
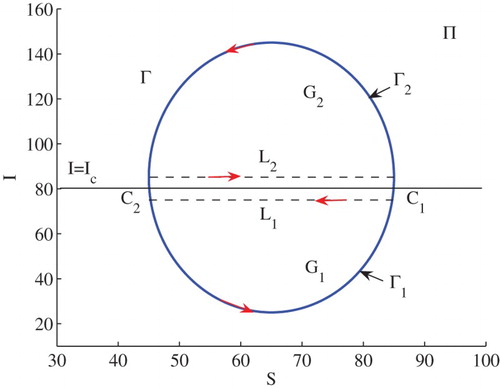
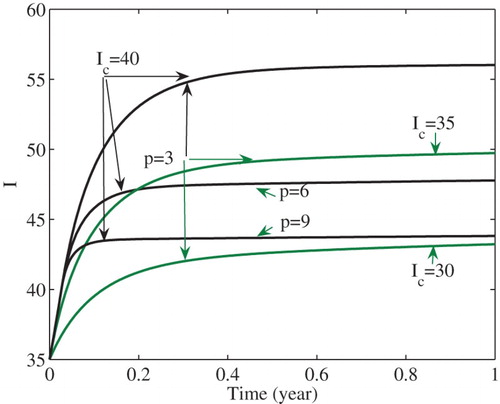
Figure 5. The number of infected cases is stabilized at decreased levels as either p increases or decreases.