Figures & data
Figure 1. Flow diagram of HAT transmission dynamics.
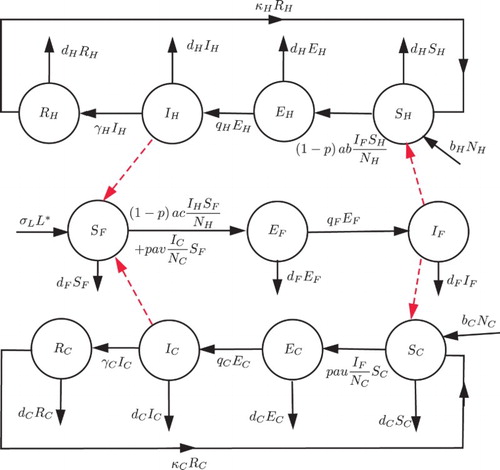
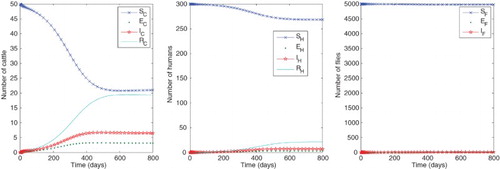
Figure 2. Numbers of humans, cattle and flies in each compartment with baseline parameter values as in Table with ,
,
and
, giving approximate equilibrium values
. For these parameter values, the reproduction numbers are
.
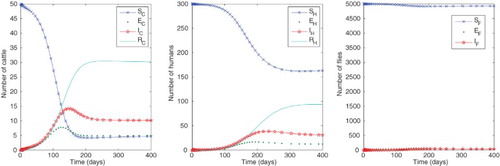
Table 1. Description of model parameters, indicating baselines, ranges and references. The first six parameters describing larval and adult fly populations are fixed at their baseline values.
Table 2. Elasticity indices of  relative to different model parameters.
Figure 3. Numbers of humans, cattle and flies in each compartment with baseline parameter values as in Table except with
,
,
,
, giving approximate equilibrium values
. For these parameter values, the reproduction numbers are
.