Figures & data
Figure 1. The flowchart representing the HBV transmission.
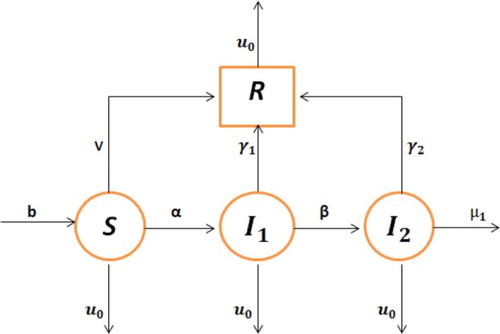
Figure 2. The plot shows the solution curves at the disease-free and endemic equilibrium with respect to set of parameters and
.
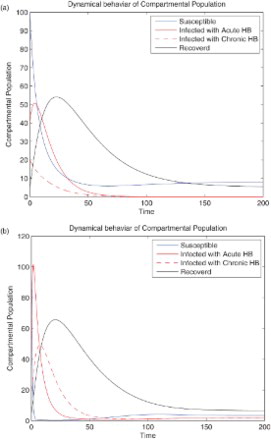
Figure 3. Population of susceptible with and without control.
Figure 4. Population of hepatitis B acute-infected individuals with and without control.
Figure 5. Population of hepatitis B chronically infected individuals with and without control.
Figure 6. Population of recovered individuals with and without control.
Figure 7. The plot shows the dynamic of control variable isolation.
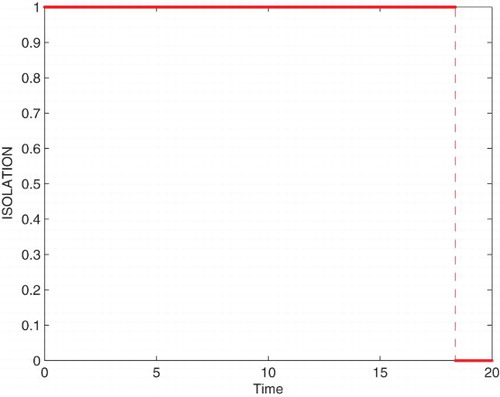
Figure 8. The plot shows the dynamic of control variable treatment.
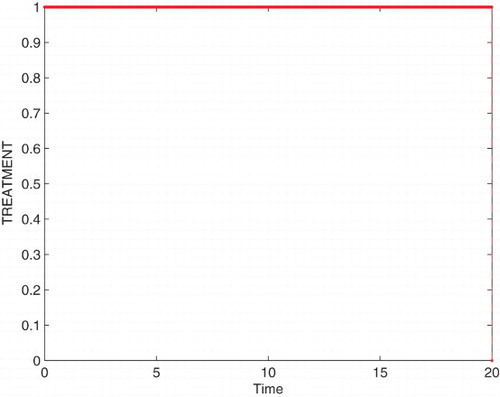
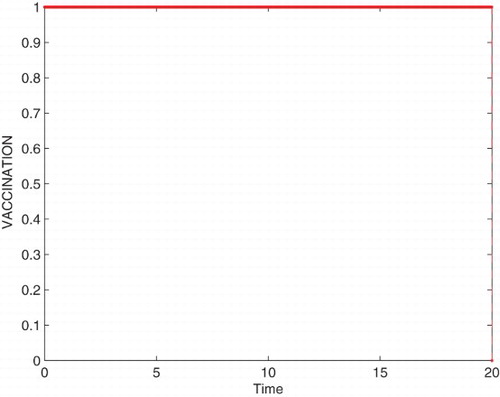
Figure 9. The plot shows the dynamic of control variable vaccination.