Figures & data
Table
Figure 1. Bacterial populations considered in the models. H represents the population of wild-type bacteria, represents the population of bacteria with prophage (lysogens),
is the population of bacteria with a CRISPR-Cas system,
are lysogens with a CRISPR-Cas system. The bacterial populations H and
are considered in Model 1,
and
in Model 2 and
and
in Model 3.
Table 1. Existence and stability conditions for the steady states in Model 1.
Table 2. Existence and stability conditions of the steady states in Model 2.
Table 3. Existence and stability conditions of the steady states in Model 3.
Table 4. Baseline values for the parameters used in this study.
Figure 2. Dynamics of phage and bacterial populations inside the biofilm at baseline parametric values. H and represent populations of wild-type bacteria and CRISPR-immune bacteria (dashed lines),
and
represent lysogens with and without CRISPR systems (dots) and V is the population of bacteriophage (solid lines). Model 1 approaches the lysogenic equilibrium LE
, Model 2 and Model 3 (case (a)) approach the phage-free equilibria (PFE
and PFE
) whereas Model 3 (case (b)) approaches the all existing equilibrium (AEE
).
Figure 3. Population densities of bacteria and bacteriophage at stable (solid lines) and unstable (dashed lines) equilibrium states against adsorption rate constant β in the above models. Each colour represents a unique population while the line width is increased to visualize overlapping populations. Bacterial populations are H (green) and (blue) in Model 1,
(black) and
(purple) in Model 2 and
and
in Model 3 whereas the phage population is represented by V (red) in all models.
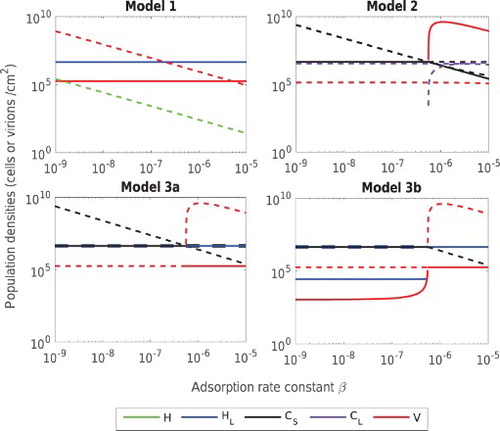
Figure 4. (a) Population densities of bacteria and bacteriophage at stable (solid lines) and unstable (dashed lines) equilibrium states against phage loss rate constant γ in the Model 3 (case (b)). Bacterial populations (black) and
(blue) and the phage population V (red) are shown. Panels (b), (c) and (d) show the critical value of φ necessary to ensure the stability of the lysogenic equilibrium, versus α, η and K. In each case, the parameter space above each curve corresponds to a stable lysogenic equilibrium (LE
) while the space under each curve corresponds to stability of the all existing equilibrium (AEE
).
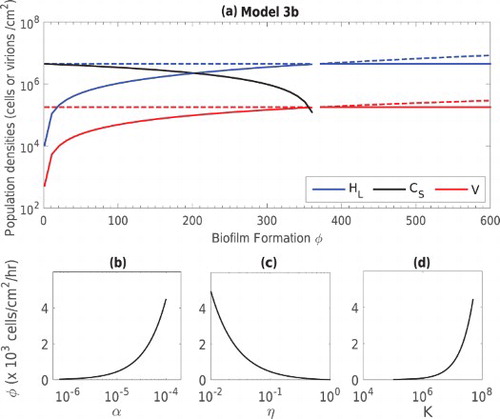
Figure 5. Population dynamics of phage-bacteria interaction in Models 2, 3 (case (b)) and 1. Three Vertical lines are drawn to separate the simulations of the models into four panels. Model 2 is simulated for baseline parameters in the first panel, Model 3 (case (b)) is first simulated for baseline parameters and then simulated after an increase in φ in the second and third panels respectively. In the fourth panel, simulations of Model 1 are presented for baseline parameters (top two curves) and for varied parameters based on possible therapy, i.e. ,
and r=0.75, (bottom two curves with increased line-width). The dashed lines represent
, dash-dot lines represent
in Model 2, and
in Model 1 and 3, whereas dots symbolize the population density of phage V.