Figures & data
Figure 1. Transfer diagram for alcoholism model with media coverage.
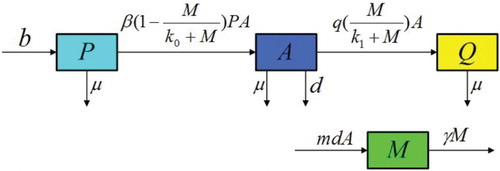
Figure 2. when , the alcohol free equilibrium
is globally asymptotically stable.
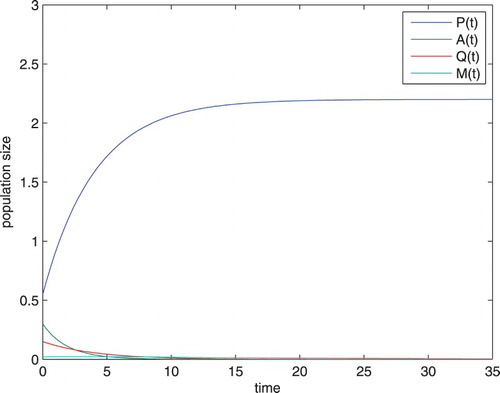
Figure 3. When , the alcohol present equilibrium
is globally asymptotically stable.
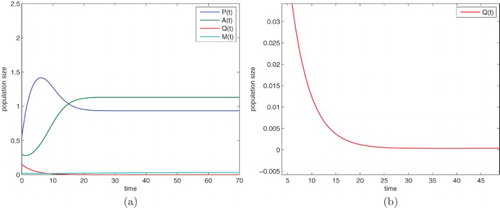
Table 1. The parameters description of the alcoholism model.
Figure 4. The influence of different values of m on the population of alcoholics.
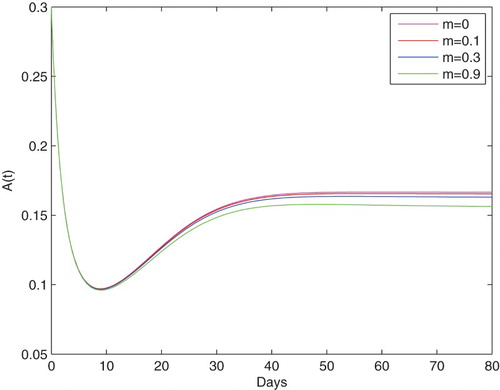
Figure 5. The influence of different values of γ on the population of alcoholics.
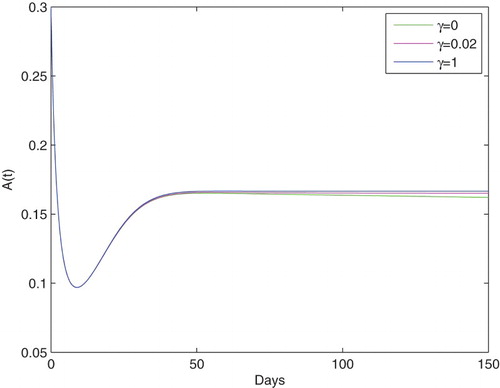
Figure 6. Variations of population with different control, where ,
.
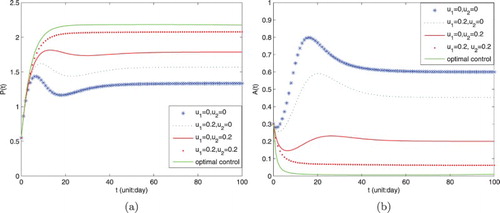
Figure 7. Variations of population with different control, where ,
.
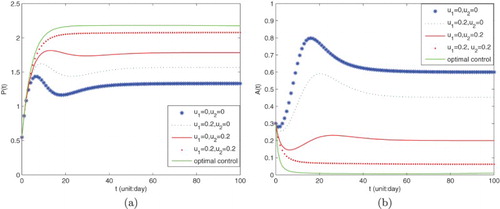
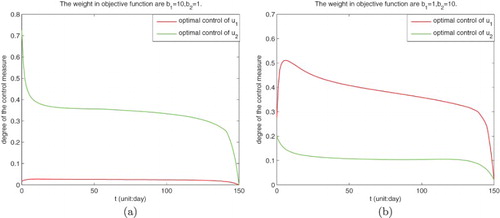
Figure 8. The impact of different weight coefficients on optimal control ,
.