Figures & data
Figure 1. Reported cases of Pneumonia disease in Ethiopia from 2009 to 2015.
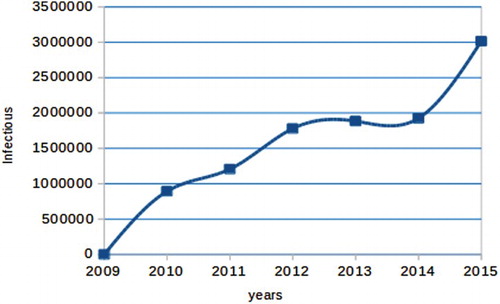
Figure 2. Flow diagram of the model.
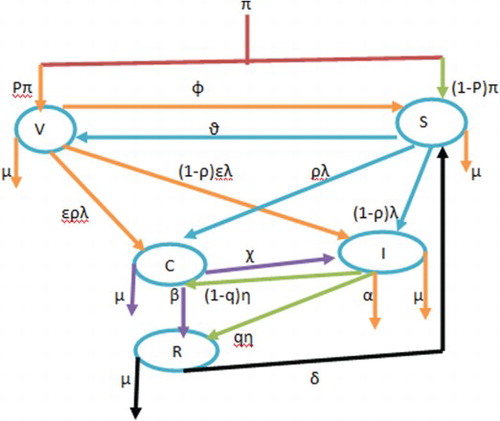
Table 1. Sensitivity indices table.
Table 2. Parameter values for the Pneumonia model.
Figure 3. Simulations of optimal control with prevention only.
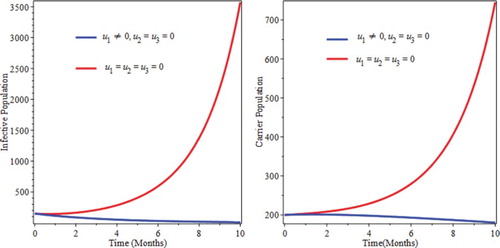
Figure 4. Simulations optimal control with treatment only.
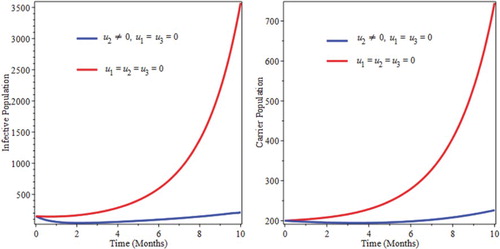
Figure 5. Simulations of optimal control with screening only.
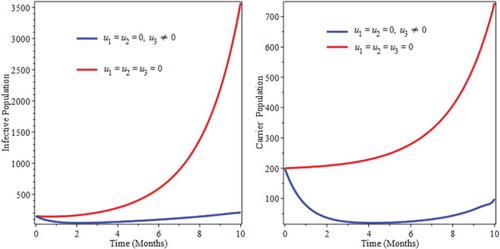
Figure 6. Simulations optimal control with prevention and treatment interventions.
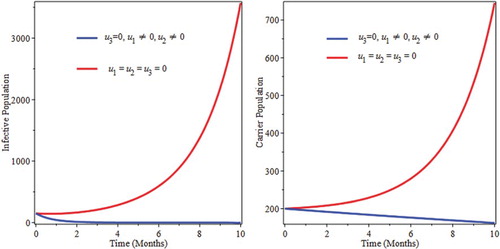
Figure 7. Simulations of optimal control with prevention and screening intervention.
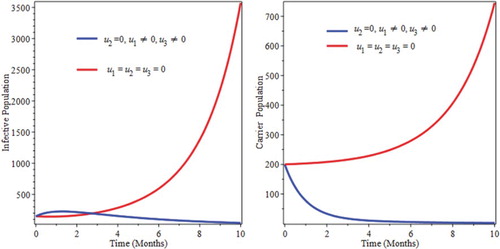
Figure 8. Simulations of optimal control with treatment and screening intervention.
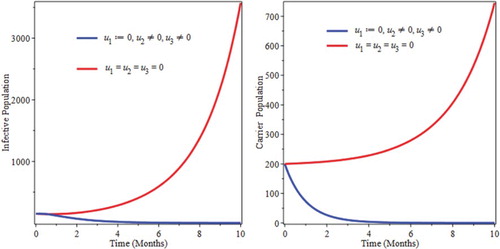
Figure 9. Simulations of optimal control with Prevention, Treatment and screening interventions.
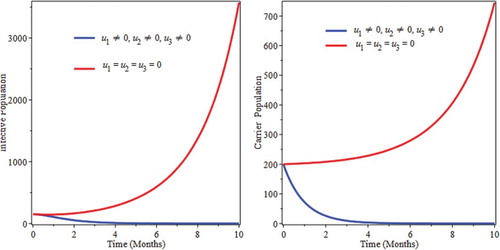
Figure 10. Backward bifurcation of the force of infection at equilibrium against the effective reproduction number .
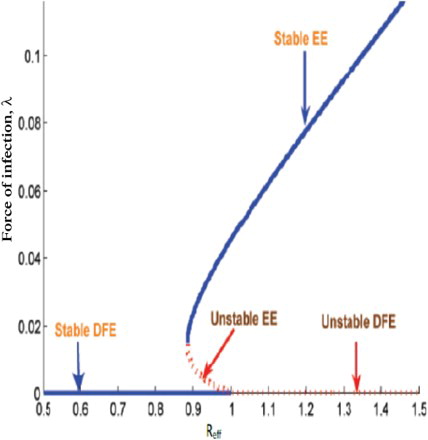
Table 3. Number of infectious averted and total cost of each strategies.
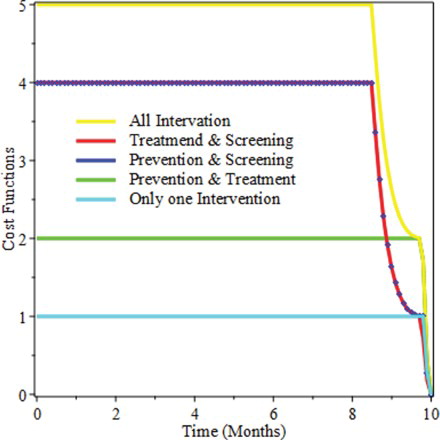
Figure 11. Cost Function of the intervention strategies for the period of 10 months.