Figures & data
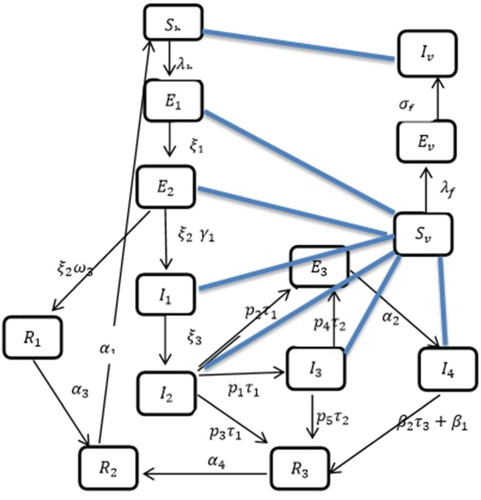
Figure 1. Flow chart representing the dynamics of the disease. The blue lines represent the interaction between susceptible and infected populations.
Table
Table 1. The sensitivity indices of parameters.
Table 2. Strategies based on treatment and vector-related interventions.
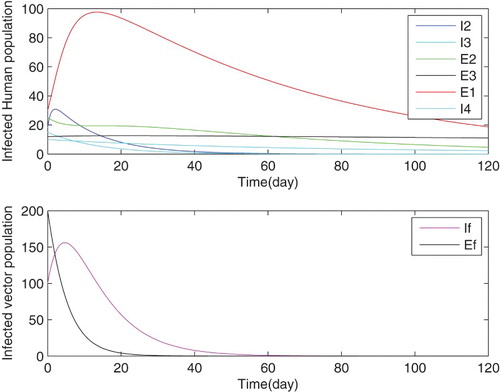
Figure 2. The time spent in elimination of infectious classes, using control strategy No. 1.
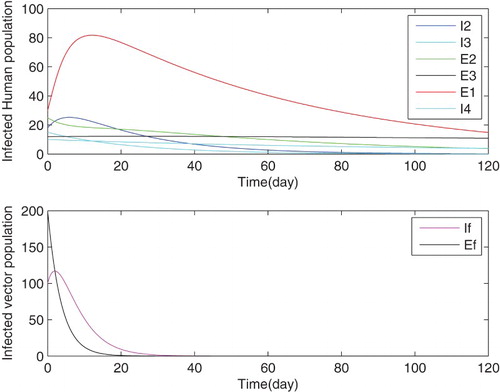
Figure 3. The time spent in elimination of infectious classes, using control strategy No. 2.
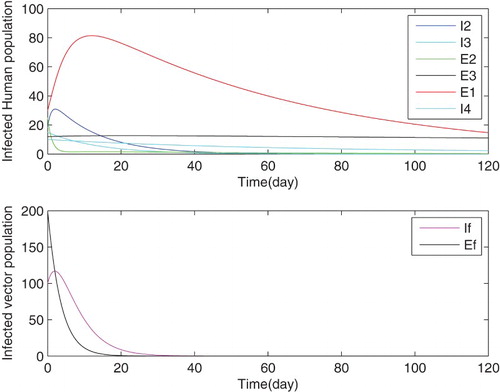
Figure 4. The time spent in elimination of infectious classes, using control strategy No. 3.
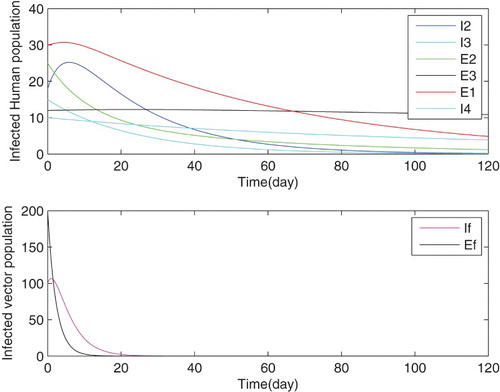
Figure 5. The time spent in elimination of infectious classes, using control strategy No. 4.