Figures & data
Table 1. Parameters description and values.
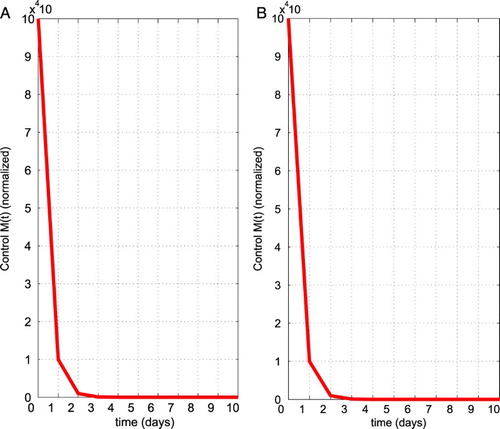
Figure 1. Sensitivity solutions of tumour cell population from (19) to (23) w.r.t a0, δ0, δ1, r and p1.
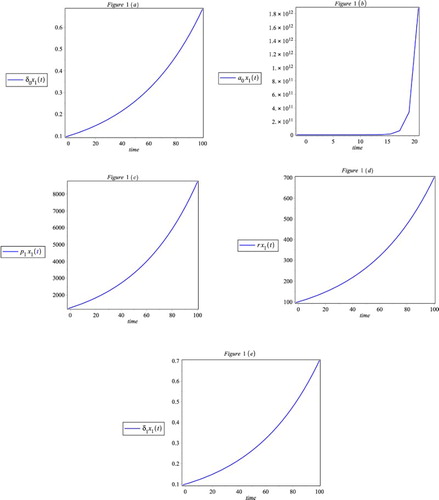
Figure 2. Plots the characteristic equation of (Equation25(25)
(25) ) for different τ values (Table ).
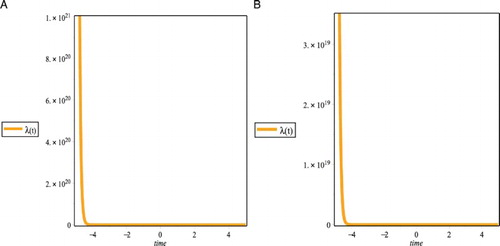
Table 2. Parameters description and values.
Figure 3. The dynamics of the tumour size in three treatment regimes. Shown are the results of the numerical simulations for Mouse data corresponding from Table with initial condition ,
,
,
,
,
.
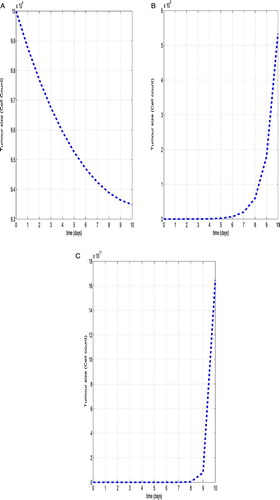
Figure 4. The dynamics of the tumour size in three treatment regimes. Shown are the results of the numerical simulations for human data corresponding from Table with initial condition ,
,
,
,
,
.
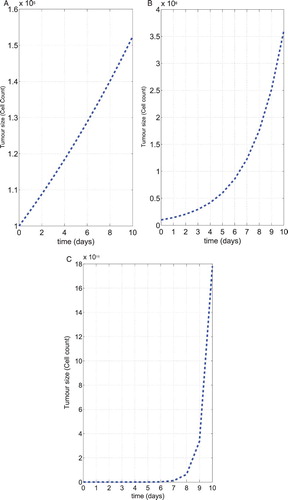
Figure 5. The optimal control graph for the chemo therapeutic drug control (M) using the parameter values given in Table with and
for mouse and human data.