Figures & data
Figure 1. The effect of the search time on the steepness coefficient, s, and tumour cell lysis, , when
.
Table 1. Parameter values in Equations (Equation9 (9) (9) )–(Equation14(14) (14) ) for patients 9 and 10 [Citation18].
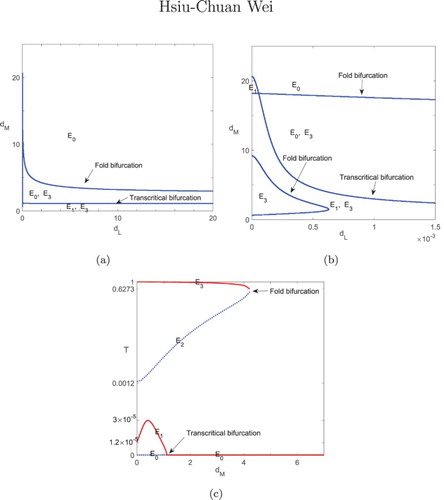
Figure 2. Bifurcation diagrams using Equations (Equation15(15)
(15) )–(Equation18
(18)
(18) ) and parameter values of patient 10 with (a) d, m, and β as the bifurcation parameters, (b) d=4.36 and m and β as the bifurcation parameters, and (c)
and m as the bifurcation parameter.
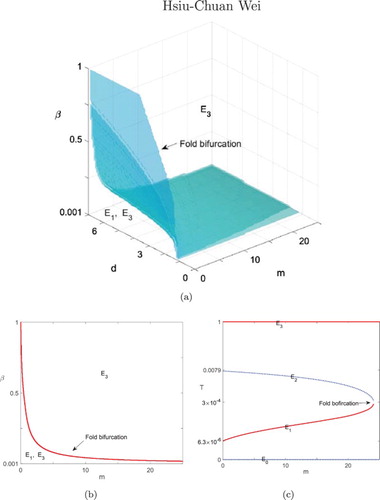
Figure 3. Bifurcation diagrams for treatments using chemotherapy alone, Equations (Equation9(9)
(9) )–(Equation14
(14)
(14) ) with
, and parameter values of patient 10 with (a) m and
as the bifurcation parameters, and (b) m=3 and
as the bifurcation parameter.
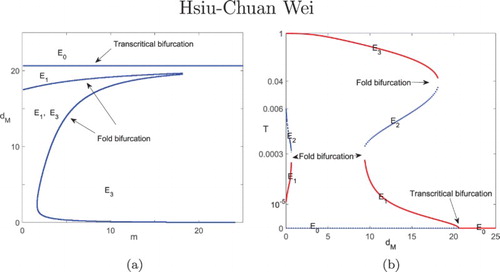
Figure 4. A bifurcation diagram using parameter values of patient 10 with m=3 and and
as the bifurcation parameters. (b) The magnification of the portion
in Figure (a). (c) A bifurcation diagram using
and
as the bifurcation parameter.