Figures & data
Figure 1. The graph shows the growth rate per capita as a function of the density (size) of the population. The three curves represent the cases of no Allee effect (brown), weak Allee effect (blue) and strong Allee effect (green).
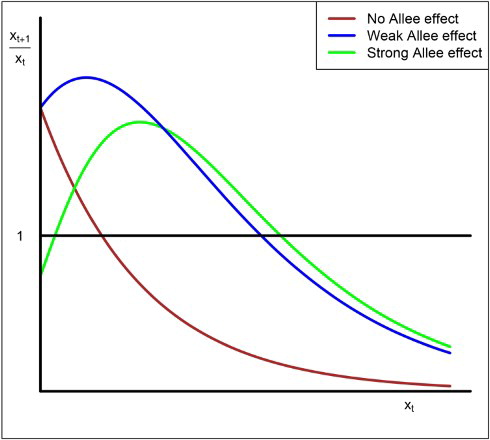
Figure 2. In the strong Allee case, there are three fixed points, (extinction),
(the Allee threshold) and
(the carrying capacity). If the initial size
of the population is less than A, then its orbits converge to 0 and the population goes to extinction.
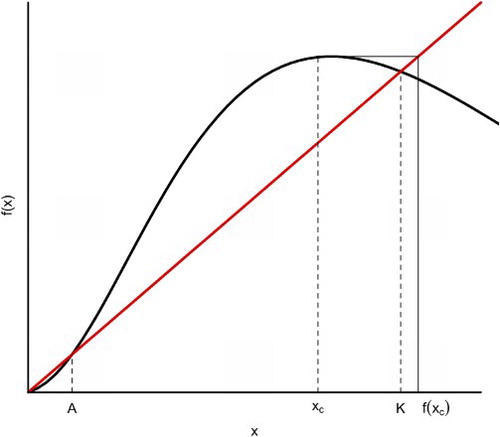
Figure 3. The graph illustrates the various scenarios that are determined by the location of . There are five scenarios where we have from zero to four interior fixed points.
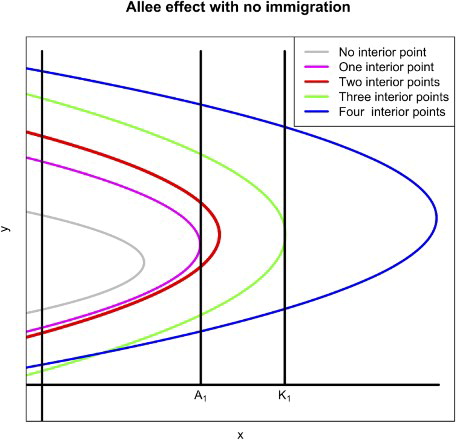
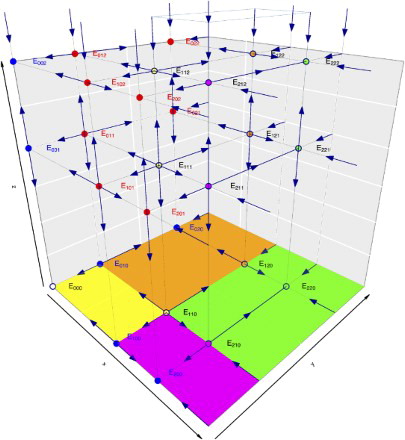
Figure 4. Phase space diagram depicting the dynamics of the three non-negative planes.
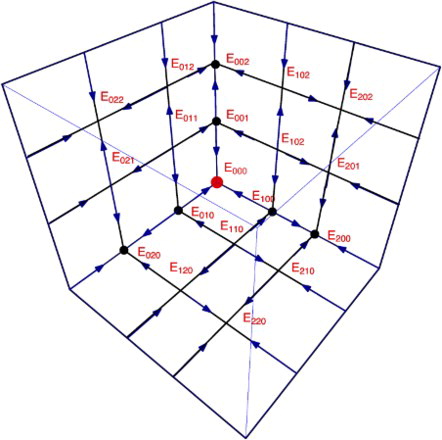
Figure 5. The phase space diagram in the case of two interior fixed points. There are three regions: extinction region (yellow), exclusion region of x (brown) and exclusion region of y (magenta).
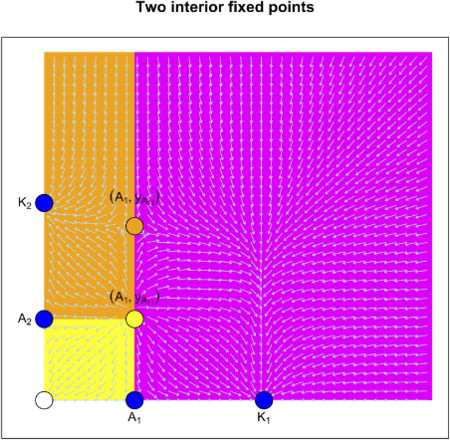
Figure 6. The phase space diagram of the x−y plane in the case of four interior fixed points. In the interior of the plane, there are four regions: extinction region (yellow), exclusion region of x (brown), exclusion region of y (magenta) and coexistence region (green).
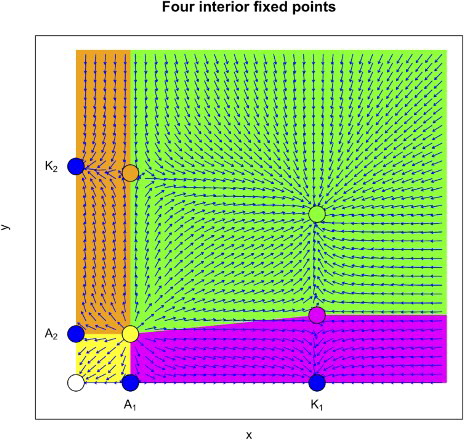
Figure 7. The figure shows the phase space diagram of the three species hierarchical Ricker model with the Allee effect. It shows the dynamics of every fixed point in the three planes, the axes, and the interior, from attractors, to repellers, and saddles.