Figures & data
Figure 1. Transfer diagram: the solid arrows represent the transition from one class to another and the blue dashed arrow represents the eggs laying of female mosquitoes.
![Figure 1. Transfer diagram: the solid arrows represent the transition from one class to another and the blue dashed arrow represents the eggs laying of female mosquitoes.](/cms/asset/aa84e080-403d-4950-9503-6df5e322a4c1/tjbd_a_1468935_f0001_c.jpg)
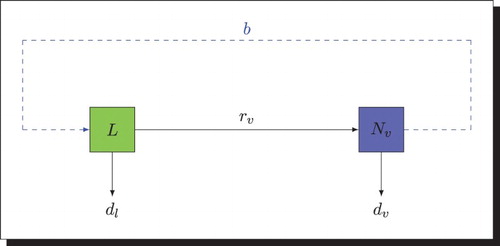
Table 1. Values for constant parameters of the model.
Figure 2. Transfer diagram: the black dashed arrows indicate the direction of the infection, the solid arrows represent the transition from one class to another and the blue dashed arrow represents the eggs laying of female mosquitoes.
![Figure 2. Transfer diagram: the black dashed arrows indicate the direction of the infection, the solid arrows represent the transition from one class to another and the blue dashed arrow represents the eggs laying of female mosquitoes.](/cms/asset/45b744de-b0ea-46eb-b9bc-df329449d8b8/tjbd_a_1468935_f0002_c.jpg)
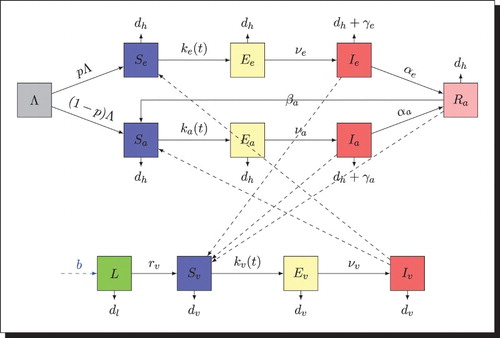
Figure 3. Distribution of infected non-immune with and
. The initial conditions are given by
. We obtain
and
. (a) Exposed non-immune and (b) infectious non-immune.
![Figure 3. Distribution of infected non-immune with dl=4,rv=15,dv=3.5,b=180,γe=0.00054,γa=0.00027 and a1=5,b1=3. The initial conditions are given by Se(0)=500,Ee(0)=250,Ie(0)=150,Sa(0)=1000,Ea(0)=500,Ia(0)=1000,Ra(0)=2000,Sv(0)=10,000,Ev(0)=4000,Iv(0)=2000 and L(0)=15,000. We obtain κ=40.6015 and R0=1.7127>1. (a) Exposed non-immune and (b) infectious non-immune.](/cms/asset/2a20b297-59e8-4ca6-8ac2-21ccd463ea09/tjbd_a_1468935_f0003_b.gif)
Figure 4. Distribution of infected semi-immune with and
. The initial conditions are given by
. We obtain
and
. (a) Exposed semi-immune and (b) infectious semi-immune.
![Figure 4. Distribution of infected semi-immune with dl=4,rv=15,dv=3.5,b=180,γe=0.00054,γa=0.00027 and a1=5,b1=3. The initial conditions are given by Se(0)=500,Ee(0)=250,Ie(0)=150,Sa(0)=1000,Ea(0)=500,Ia(0)=1000,Ra(0)=2000,Sv(0)=10,000,Ev(0)=4000,Iv(0)=2000 and L(0)=15,000. We obtain κ=40.6015 and R0=1.7127>1. (a) Exposed semi-immune and (b) infectious semi-immune.](/cms/asset/38641721-4639-4985-83c3-93d7d7a4d4c4/tjbd_a_1468935_f0004_b.gif)
Figure 5. Distribution of infected mosquitoes with and
. The initial conditions are given by
. We obtain
and
. (a) Exposed mosquitoes and (b) infectious mosquitoes.
![Figure 5. Distribution of infected mosquitoes with dl=4,rv=15,dv=3.5,b=180,γe=0.00054,γa=0.00027 and a1=5,b1=3. The initial conditions are given by Se(0)=500,Ee(0)=250,Ie(0)=150,Sa(0)=1000,Ea(0)=500,Ia(0)=1000,Ra(0)=2000,Sv(0)=10,000,Ev(0)=4000,Iv(0)=2000, and L(0)=15,000. We obtain κ=40.6015 and R0=1.7127>1. (a) Exposed mosquitoes and (b) infectious mosquitoes.](/cms/asset/05d3d1d1-f942-49e1-a8f3-03976095f932/tjbd_a_1468935_f0005_b.gif)
Figure 6. Distribution of infected non-immune with . The initial conditions are given by
and
. We obtain
and
. (a) Exposed non-immune and (a) infectious non-immune.
![Figure 6. Distribution of infected non-immune with a1=3,b1=2.5,dl=4,dv=7.5,b=90,γe=γa=0. The initial conditions are given by Se(0)=500,Ee(0)=500,Ie(0)=1000,Sa(0)=1000,Ea(0)=500,Ia(0)=1000,Ra(0)=2000,Sv(0)=10,000,Ev(0)=8000,Iv(0)=4000 and L(0)=15,000. We obtain κ=9.47 and R0=0.3828<1. (a) Exposed non-immune and (a) infectious non-immune.](/cms/asset/19392388-e98b-474d-94bc-068b3d5ff79c/tjbd_a_1468935_f0006_c.jpg)
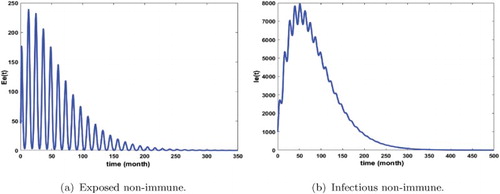
Figure 7. Distribution of semi-immune infected with . The initial conditions are given by
and
. We obtain
and
. (a) Exposed semi-immune and (b) infectious semi-immune.
![Figure 7. Distribution of semi-immune infected with a1=3,b1=2.5,dl=4,dv=7.5,b=90,γe=γa=0. The initial conditions are given by Se(0)=500,Ee(0)=500,Ie(0)=1000,Sa(0)=1000,Ea(0)=500,Ia(0)=1000,Ra(0)=2000,Sv(0)=10,000,Ev(0)=8000,Iv(0)=4000 and L(0)=15,000. We obtain κ=9.47 and R0=0.3828<1. (a) Exposed semi-immune and (b) infectious semi-immune.](/cms/asset/30b72dea-c923-4495-b4e3-be329b2ef2d1/tjbd_a_1468935_f0007_c.jpg)
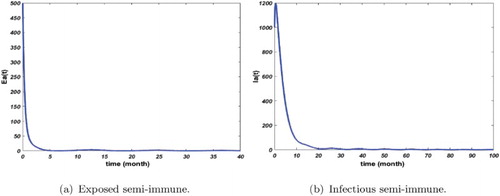
Figure 8. Distribution of infected mosquitoes with . The initial conditions are given by
and
. We obtain
and
. (a) Exposed mosquitoes and (b) infectious mosquitoes.
![Figure 8. Distribution of infected mosquitoes with a1=3,b1=2.5,dl=4,dv=7.5,b=90,γe=γa=0. The initial conditions are given by Se(0)=500,Ee(0)=500,Ie(0)=1000,Sa(0)=1000,Ea(0)=500,Ia(0)=1000,Ra(0)=2000,Sv(0)=10,000,Ev(0)=8000,Iv(0)=4000 and L(0)=15,000. We obtain κ=9.47 and R0=0.3828<1. (a) Exposed mosquitoes and (b) infectious mosquitoes.](/cms/asset/0f58bd0e-6077-42ae-b878-9c0bbb55c07d/tjbd_a_1468935_f0008_c.jpg)
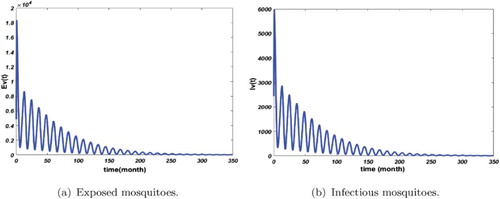
Figure 9. Distribution of infected non-immune and semi-immune with and
. The initial conditions are given by
and
. We get
and
. (a) Infectious non-immune and (b) infectious semi-immune.
![Figure 9. Distribution of infected non-immune and semi-immune with dl=6.5,rv=7,dv=7.5,b=20,γe=γa=0 and a1=5,b1=3. The initial conditions are given by Se(0)=500,Ee(0)=250,Ie(0)=150,Sa(0)=1000,Ea(0)=500,Ia(0)=1000,Ra(0)=2000,Sv(0)=10,000,Ev(0)=4000,Iv(0)=2000 and L(0)=15,000. We get κ=1.3827 and R0=0.2139<1. (a) Infectious non-immune and (b) infectious semi-immune.](/cms/asset/4721caa0-9169-4cca-a3fc-b59763b2cdca/tjbd_a_1468935_f0009_c.jpg)
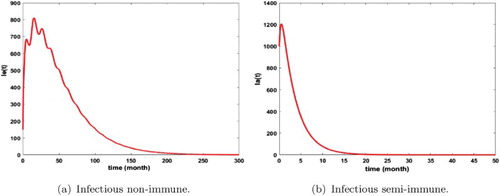
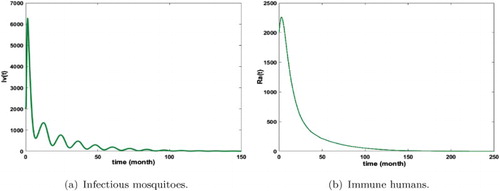
Figure 10. Distribution of infected mosquitoes and immune humans with and
. The initial conditions are given by
and
. We get
and
. (a) Infectious mosquitoes and (b) immune humans.
![Figure 10. Distribution of infected mosquitoes and immune humans with dl=6.5,rv=7,dv=7.5,b=20,γe=γa=0 and a1=5,b1=3. The initial conditions are given by Se(0)=500,Ee(0)=250,Ie(0)=150,Sa(0)=1000,Ea(0)=500,Ia(0)=1000,Ra(0)=2000,Sv(0)=10,000,Ev(0)=4000,Iv(0)=2000 and L(0)=15,000. We get κ=1.3827 and R0=0.2139<1. (a) Infectious mosquitoes and (b) immune humans.](/cms/asset/c3602dcf-e73b-42a3-af7e-96b42458bdf8/tjbd_a_1468935_f0010_c.jpg)
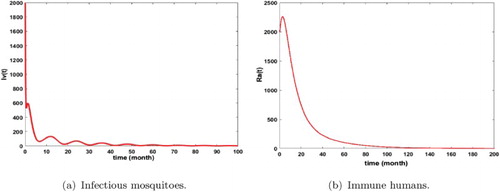
Figure 11. Distribution of infected non-immune and semi-immune with and
. The initial conditions are given by
and
. We get
and
. (a) Infectious non-immune and (b) infectious semi-immune.
![Figure 11. Distribution of infected non-immune and semi-immune with dl=4,rv=15,dv=3.5,b=180,γe=γa=0 and a1=5,b1=3. The initial conditions are given by Se(0)=500,Ee(0)=250,Ie(0)=150,Sa(0)=1000,Ea(0)=500,Ia(0)=1000,Ra(0)=2000,Sv(0)=10,000,Ev(0)=4000,Iv(0)=2000 and L(0)=15,000. We get κ=1.3827 and R0=0.2126=1.4173×0.15<1. (a) Infectious non-immune and (b) infectious semi-immune.](/cms/asset/7fad06c5-585a-4b5c-9d8e-94c2643d9e75/tjbd_a_1468935_f0011_c.jpg)
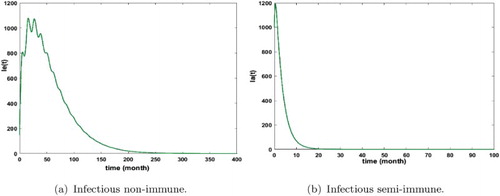
Figure 12. Distribution of infected mosquitoes and immune humans with and
. The initial conditions are given by
and
. We get
and
. (a) Infectious mosquitoes and (b) immune humans.
![Figure 12. Distribution of infected mosquitoes and immune humans with dl=4,rv=15,dv=3.5,b=180,γe=γa=0 and a1=5,b1=3. The initial conditions are given by Se(0)=500,Ee(0)=250,Ie(0)=150,Sa(0)=1000,Ea(0)=500,Ia(0)=1000,Ra(0)=2000,Sv(0)=10,000,Ev(0)=4000,Iv(0)=2000 and L(0)=15,000. We get κ=1.3827 and R0=0.2126=1.4173×0.15<1. (a) Infectious mosquitoes and (b) immune humans.](/cms/asset/69db9a7b-64d0-432a-a9c9-d4212dc4f32f/tjbd_a_1468935_f0012_c.jpg)