Figures & data
Figure 1. CHIKV replication cycle [Citation34].
![Figure 1. CHIKV replication cycle [Citation34].](/cms/asset/8c088b31-314b-4f9f-ad30-b0ecde960b8d/tjbd_a_1503349_f0001_c.jpg)
Table 1. The data of system (Equation42 (42) (42) )–(Equation46(46) (46) ).
Figure 2. The concentration of uninfected monocytes.
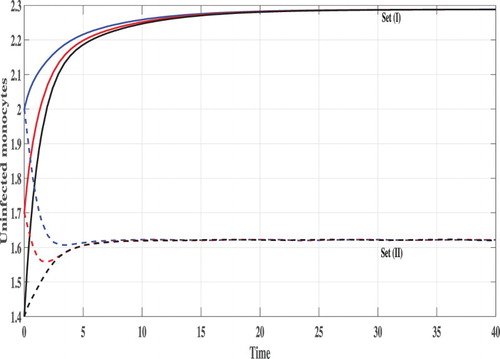
Figure 3. The concentration of latently infected monocytes.
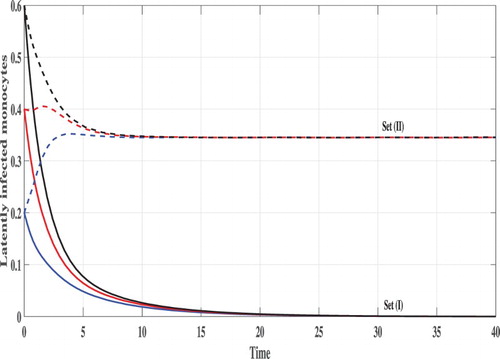
Figure 4. The concentration of actively infected monocytes.
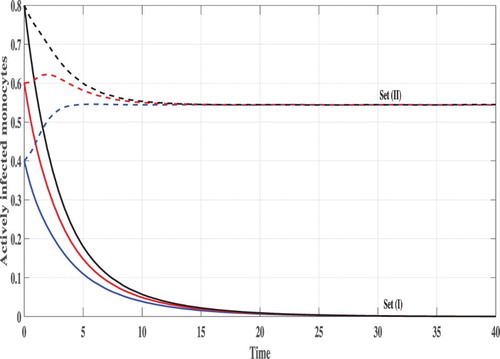
Figure 5. The concentration of free CHIKV particles.
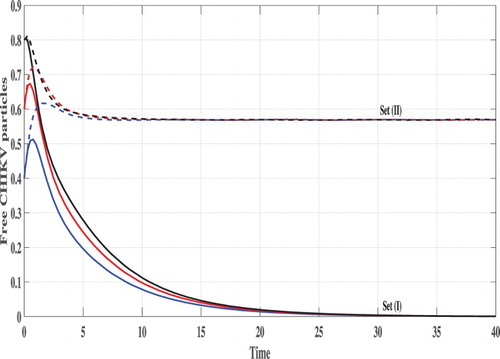
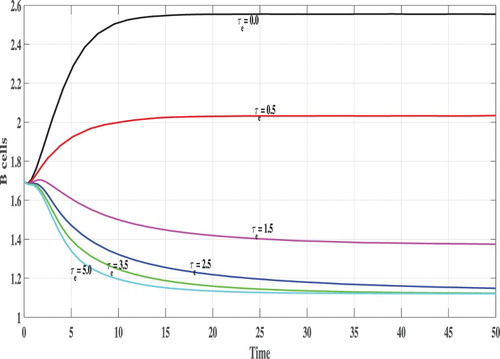
Figure 6. The concentration of B cells.
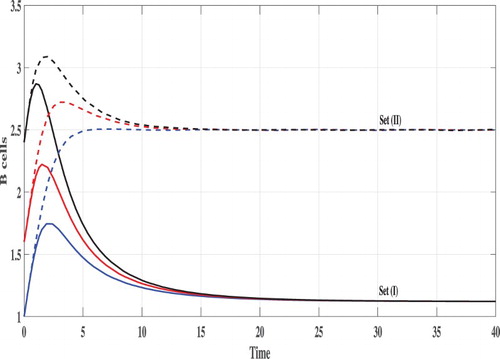
Figure 7. The concentration of uninfected monocytes.
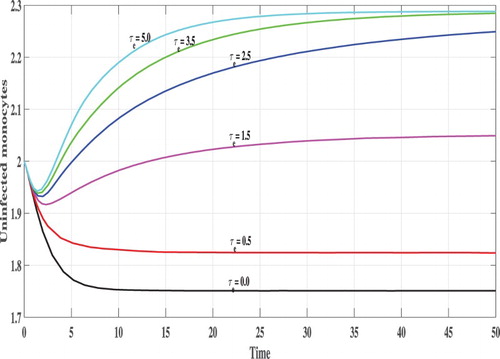
Figure 8. The concentration of latently infected monocytes.
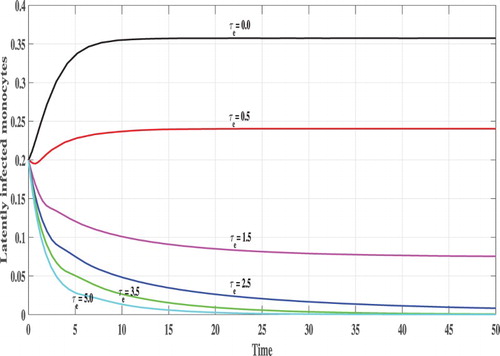
Figure 9. The concentration of actively infected monocytes.
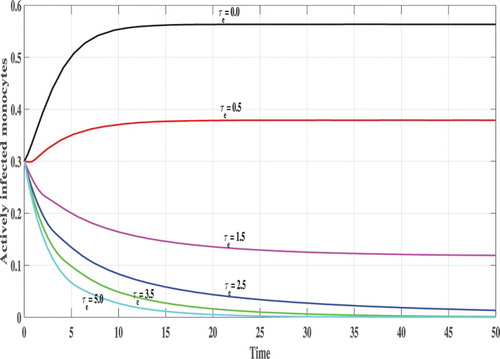
Figure 10. The concentration of free CHIKV particles.
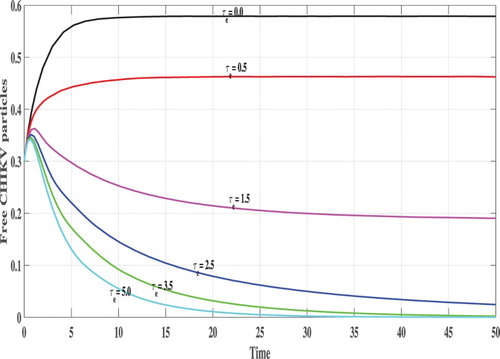
Figure 11. The concentration of B cells.