Figures & data
Table 1. Nomenclature.
Table 2. Baseline values for the parameters used in this study.
Figure 1. Classes of three populations are presented in the above figure: phage populations (dashed lines), bacterial populations with CRISPR/Cas systems (dash-dot lines) and lysogens (solid lines). The therapeutic procedure time is set. The lysogens are inserted into the biofilm with up to three prophages either simultaneously or successively. The possible sequences of the number of prophages harboured in the lysogens are
and
, as described in the text. The colours of the curves are used to distinct each class of lysogen and CRISPR bacteria and are associated as described in the legend:
and
is for grey,
and
is for blue,
and
is for green,
and
is for cyan,
and
is for red,
and
is for pink,
and
is for cream,
and
is for black. Colours for phage populations are blue for
, cyan for
and black for
. Coloured areas under curves of therapeutic lysogens represent the insertion phase whereas light grey areas under curves correspond to the competence phase.
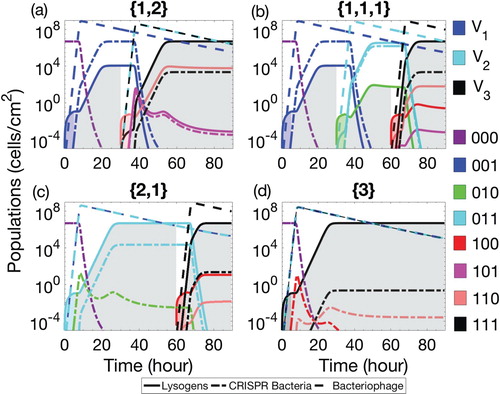
Figure 2. Populations of CRISPR bacteria at the final time of therapeutic procedure of 60, 90 and 180 h. The insertion phase is varied between 0 and 15 h for each therapeutic sequence. Four possible combinations of prophages are considered: (a) one prophage followed by two simultaneously, denoted by , (b) three prophages each introduced separately, denoted
, (c) two prophages simultaneously followed by one separately,
, and finally (d) introduction of a lysogen containing all three prophage sequences,
. Therapeutic procedures for 60, 90 and 180 h are represented by blue circles, black solid lines and red + signs, respectively.
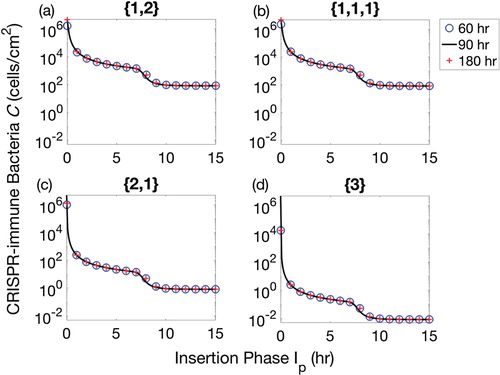
Figure 3. Three sets of bar plots for the population of CRISPR bacteria in the biofilm against each therapeutic sequence with 90-h procedural time. For the first set of therapeutic sequences, first four bars on the left, lysogen are inserted in the biofilm at the start of the first growth period of each element of the therapeutic lysogen sequence (new class of lysogen). For the second set of therapeutic sequences, middle four bars, lysogen are inserted for 1 h at the start of the first growth period of each element of the therapeutic sequence and 4 h at the end of the second growth period of the same element of therapeutic sequence. Similarly, for third set of sequences (last four bars), lysogen are inserted for 1 h in the start of the first growth period of each element of the therapeutic sequence and 4 h at the start of second growth period of the same element of therapeutic sequence. Each set contains four possible sequences namely lysogen with one prophage followed by two simultaneously, denoted by (black colour), three prophages each introduced separately, denoted
(blue colour), two prophages simultaneously followed by one separately,
(cyan colour), and all prophages simultaneously,
(red colour).
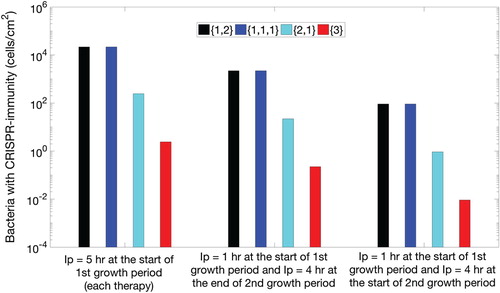
Figure 4. Populations of CRISPR bacteria (C) against biofilm formation rate (subplots (a) and (c)) and adsorption rate β (subplots (b) and (d)) for 90-h therapeutic procedure. Four possible combinations of prophages are presented in each subplot, namely lysogen with one prophage followed by two simultaneously, denoted by
(solid line), three prophages each introduced separately, denoted
(dashed line), two prophages simultaneously followed by one separately,
(dotted line), and all prophages simultaneously,
(dash-dotted line).
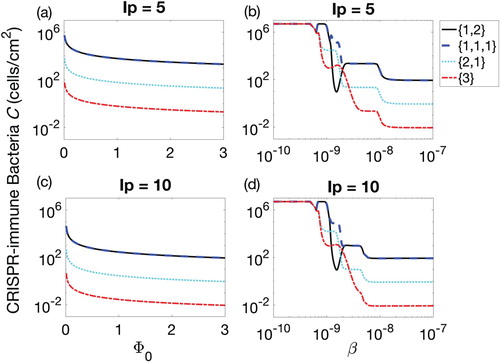
Figure 5. Parameter space defined between the biofilm formation rate and the adsorption rate β for 90-h therapeutic procedure. Colour bar on the right shows the colours pattern for the population density of CRISPR bacteria. Dark blue is the least population density, i.e. 0.01, while bright yellow is the population density of CRISPR bacteria near carrying capacity. Biofilm formation rate
is varied from 0.001 to 3 cells/cm2/h and adsorption rate is varied between
and
. Four possible combinations of prophages are considered: (a) one prophage followed by two simultaneously, denoted by
(solid line), (b) three prophages each introduced separately, denoted
(dashed line), (c) two prophages simultaneously followed by one separately,
(dotted line), and finally (d) introduction of a lysogen containing all three prophage sequences,
(dash-dotted line).
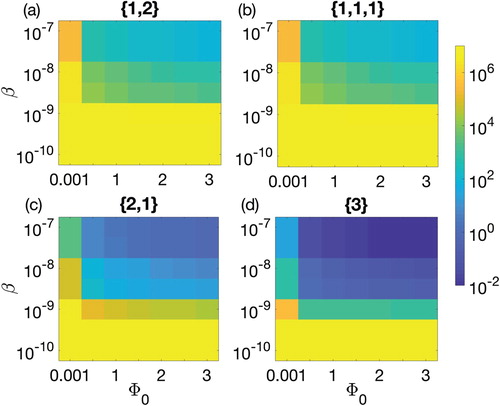
Figure 6. Parameter space between the biofilm formation rate and the probability of gaining spacer
for 90-h therapeutic procedure. Colour bar on the right shows the colour pattern for the population density of CRISPR bacteria. Dark blue is the least population density, i.e. 0.0005, while bright yellow is the population density of CRISPR bacteria near carrying capacity
. Four possible combinations of prophages are considered: (a) one prophage followed by two simultaneously, denoted by
(solid line), (b) three prophages each introduced separately, denoted
(dashed line), (c) two prophages simultaneously followed by one separately,
(dotted line), and finally (d) introduction of a lysogen containing all three prophage sequences,
(dash-dotted line).
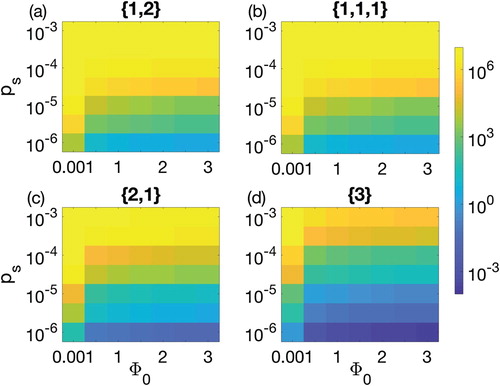
Figure 7. Populations of CRISPR-immune bacteria at the final time after simultaneous insertion of lysogens with 1, 2, 3, 4 and 5 prophages. Each bar represents either population density of lysogen L, bacteria with CRISPR/Cas system C or phage V. The insertion phase is 5 h while the rest of the time is for the competence phase until the populations show a steady state for long enough time.
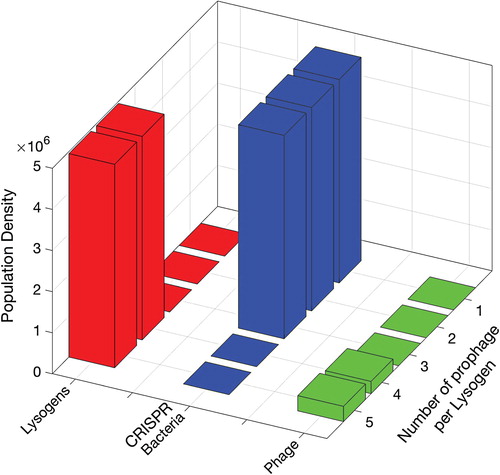
Figure A.1. Populations of CRISPR-immune bacteria (C) against probability of lysogeny at the final time t=180 h. Lysogen are introduced with one, two or three prophages at a time. Four possible combinations of prophages are considered for each procedure, namely one prophage followed by two simultaneously, denoted by
(solid line), three prophages each introduced separately, denoted
(dashed line), two prophages simultaneously followed by one separately,
(dotted line), and finally the introduction of a lysogen containing all three prophage sequences,
(dash-dotted line).
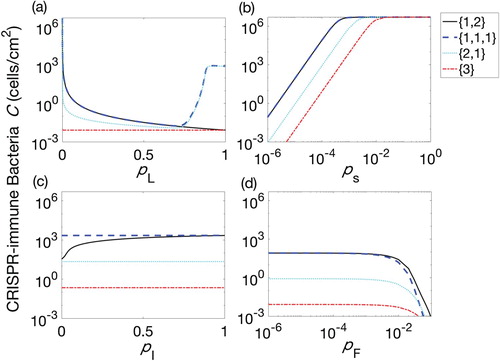
Table A1. Four strategies of therapeutic procedures are defined, namely constant phases, mixed phases, semi-mixed phases and separate phases.
Figure A.2. Colour combinations for the therapeutic procedure. Blue, cyan and black colours are used for the population of the first, second and third phage, respectively. The bacterial populations are based on the combinations of associated phages as follows. and
: Gray;
and
: Blue;
and
: green;
and
: Cyan;
and
: Red;
and
: Pink;
and
: Rose;
and
: Black.
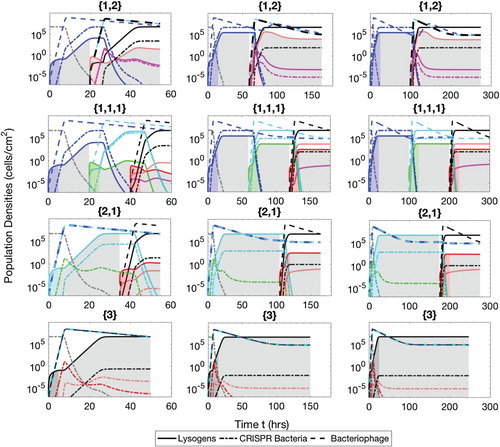
Figure A.3. Populations of bacteria with CRISPR/Cas systems (dash-dot lines), lysogens (solid lines) and phage (dash lines) during the mixed phases therapeutic procedure. The simulation times are h (
and
), 180 h (
and
) and 300 h (
and
). The lysogens are inserted into the biofilm with up to three prophages either simultaneously or successively. The possible sequences of the number of prophages harboured in the lysogens are
and
, as described in the text.
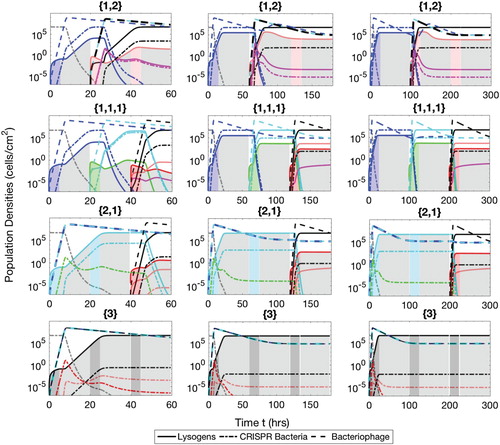
Figure A.4. Populations of bacteria with CRISPR/Cas systems (dash-dot lines), lysogens (solid lines) and phage (dash lines) during the semi-mixed phases therapeutic procedure. The simulation times are t=60 h ( and
), 180 h (
and
) and 300 h (
and
). The lysogens are inserted into the biofilm with up to three prophages either simultaneously or successively. The possible sequences of the number of prophages harboured in the lysogens are
and
, as described in the text.
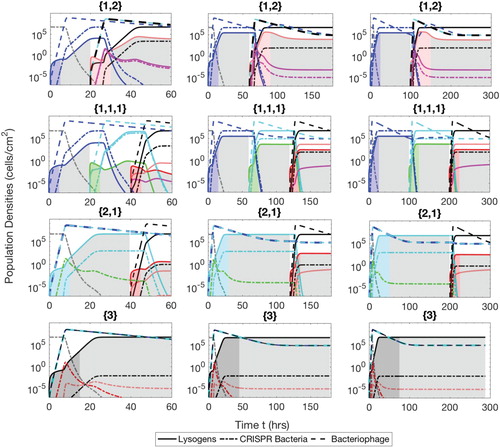
Figure A.5. Populations of bacteria with CRISPR/Cas systems (dash-dot lines), lysogens (solid lines) and phage (dash lines) during the separate phase therapeutic procedure. The simulation times are t=60 h ( and
), 180 h (
and
) and 300 h (
and
). The lysogens are inserted into the biofilm with up to three prophages either simultaneously or successively. The possible sequences of the number of prophages harboured in the lysogens are
and
, as described in the text.
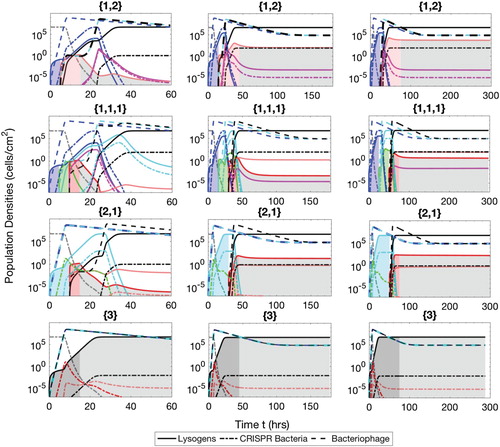
Figure A.6. Populations of bacteria with CRISPR/Cas systems (dash-dot lines), lysogens (solid lines) and phage (dash lines) during the constant phase therapeutic procedure. The simulation times are t=60 h ( and
), 180 h (
and
) and 300 h (
and
). The lysogens are inserted into the biofilm with up to three prophages either simultaneously or successively. The possible sequences of the number of prophages harboured in the lysogens are
and
, as described in the text.