Figures & data
Table 1. List of parameter values.
Figure 1. Time evolution of the infective population ,
,
for system (Equation2
(2)
(2) ) with initial value
and
. (a) and (b) with
, (c) and (d) with
.
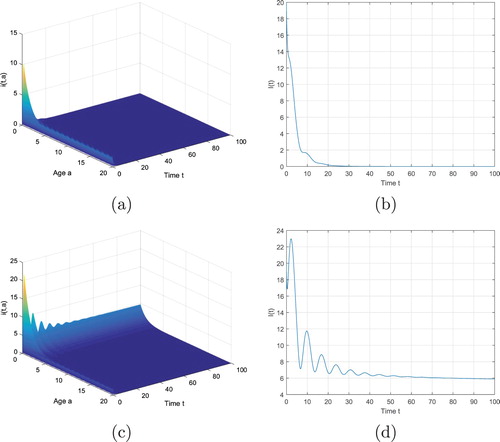
Figure 2. Time evolution of the infective population ,
,
for system (Equation2
(2)
(2) ) with different vaccinated rates and input rate. (a) with
(b) with
.
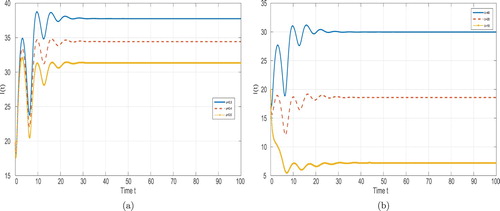
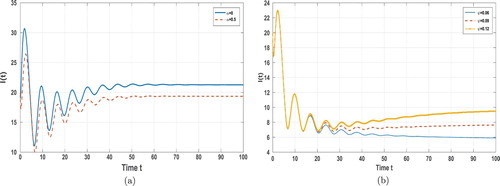
Figure 3. Time evolution of the infective population ,
,
for system (Equation2
(2)
(2) ) with different transmission rates and different immunity waning rates. (a) with different values
, (b) with different immunity waning rates
.