Figures & data
Figure 1. Model diagram depicting the dengue transmission dynamics.
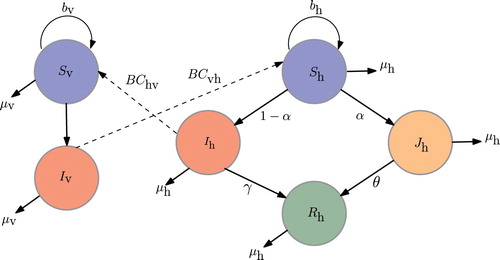
Table 1. Parameters values used in the dengue transmission model.
Table 2. Initial conditions used in the dengue transmission model.
Figure 2. Dynamics of the healthcare-seeking class under varying model parameters. (a) Effect of varying α on the healthcare-seeking class, . (b) Effect of varying B on the healthcare-seeking class,
. (c) Effect of varying
on the healthcare-seeking class,
. (d) Effect of varying
on the healthcare-seeking class,
.
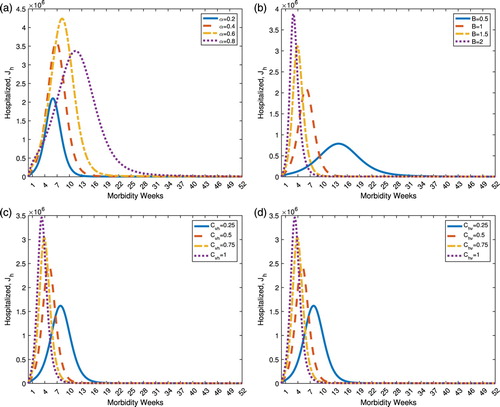
Figure 3. (a) Bar graphs and (b) time course plots of the partial rank correlation coefficients (PRCCs) of the model parameters at 14 different time points (week 2, 4, 6, 8, 10, 12, 14, 16, 18, 20, 22.5, 25, 27.5, 30) having the healthcare-seeking class as the reference model output. Model parameters were sampled 1000 times. (a) PRCC of the model parameters. (b) PRCC plotted over time.
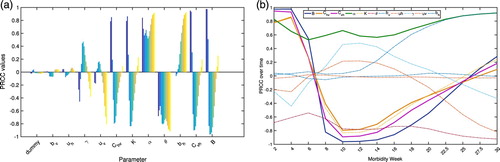
Figure 4. Scatter plots of the residuals of linear regressions of the parameter () versus all the parameters of the dengue model (abscissa) and the residuals of the regression of the model output (
) versus the parameter (
) (ordinate). Corresponding PRCCs and p-values are obtained at different time points (week 4, 8, 12, 20). (a) Residual scatter plots for α. (b) Residual scatter plots for B. (c) Residual scatter plots for
. (d) Residual scatter plots for
.
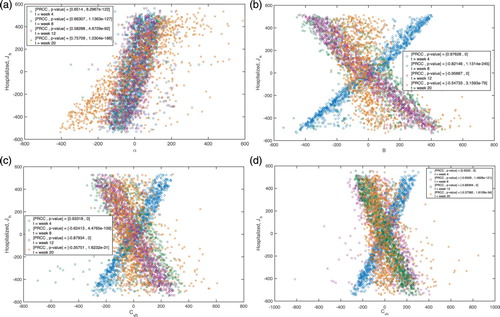
Table 3. Partial rank correlation coefficients (PRCCs) of the model parameters at different time points (week 4, 8, 12, 20) having the healthcare-seeking class as the reference model output.
Figure 5. The reported Philippine dengue cases by morbidity week in 2014 and 2015.
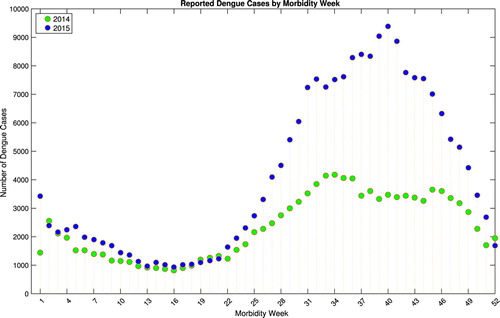
Figure 6. The reported dengue cases by morbidity week and cumulative sum in the Philippines from week 16 to 52 of 2014 and the corresponding model identification. (a) The reported 2014 Philippine dengue cases by morbidity week and the model estimation. (b) The reported 2014 cumulative Philippine dengue cases and the model estimation.
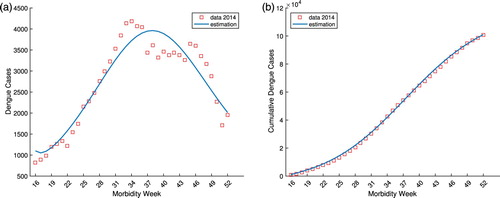
Figure 7. The reported dengue cases by morbidity week and cumulative sum in the Philippines from week 16 to 52 of 2015 and the corresponding model identification. (a) The reported 2015 Philippine dengue cases by morbidity week and the model estimation. (b) The reported 2015 cumulative Philippine dengue cases and the model estimation.
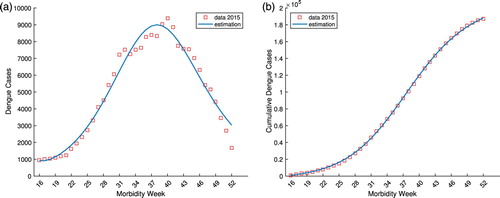
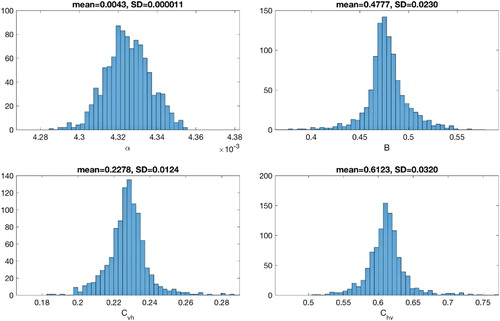
Figure 8. Bootstrap distributions of the parameter estimates and
obtained from 1000 resampling Poisson distribution of 2014 Philippine dengue data by morbidity week.
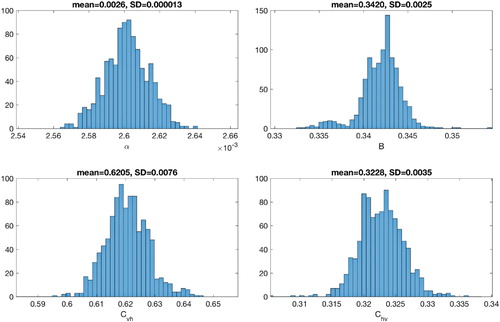
Figure 9. Bootstrap distributions of the parameter estimates and
obtained from 1000 resampling Poisson distribution of 2015 Philippine dengue data by morbidity week.