Figures & data
Table 1. Descriptions of various parameters.
Figure 1. Effect of apoptosis.
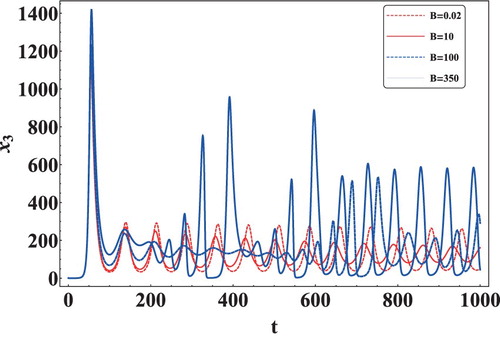
Table 2. The value of the various parameters.
Figure 2. Comparison of single and combination therapy with black line showing single therapy and red line showing combination therapy.
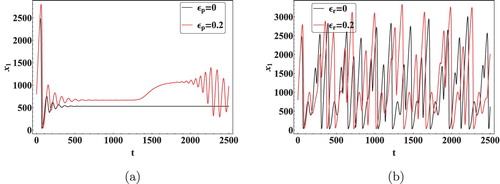
Figure 3. Effect of RTI and PI on the concentration of uninfected T cells (a) density of uninfected T cells for the different efficacy of PI keeping RTI fixed at 0.4, (b) density of uninfected T cells for the different efficacy of PI keeping RTI fixed at 0.4.
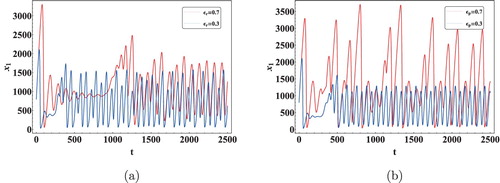
Figure 4. Plots showing the asymptotic stability of the infected equilibrium when
.
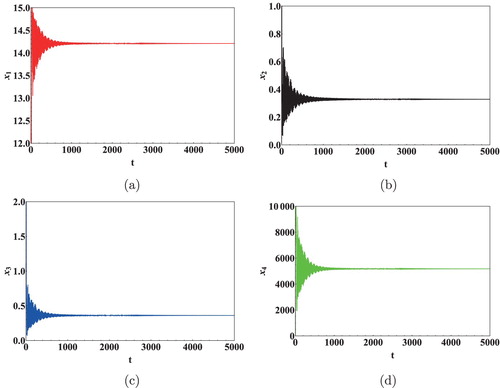
Figure 5. Plots showing the occurrence of periodic solutions of the infected equilibrium when
.
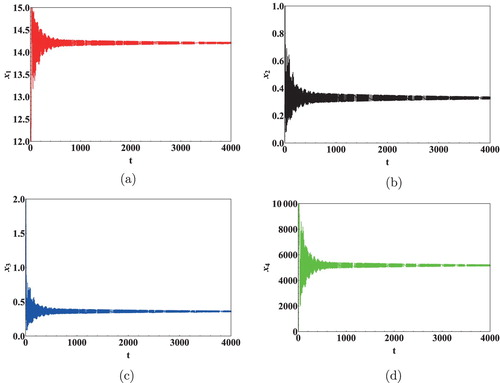
Figure 6. Plots showing the asymptotic stability of the infected equilibrium when
.
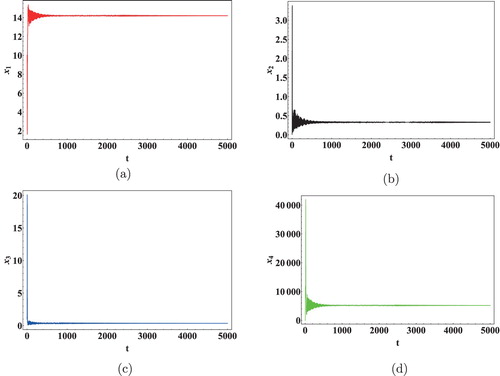
Figure 7. Plots showing the occurrence of periodic solutions of the infected equilibrium when
.
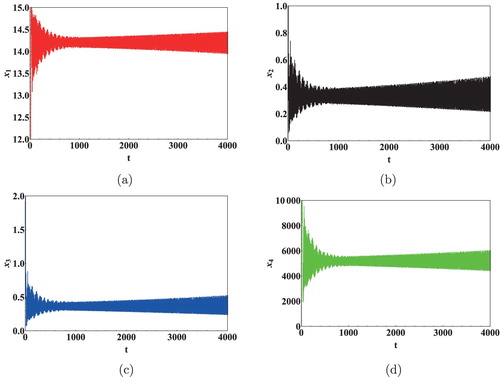
Figure 8. Sensitive dependence of solutions on initial conditions.
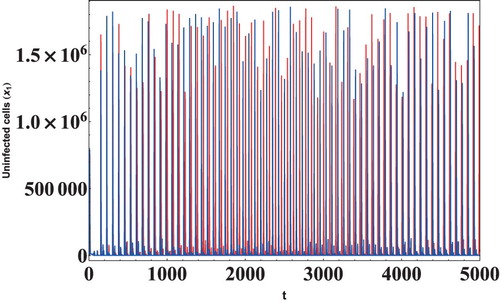
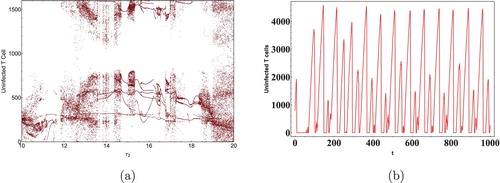
Figure 9. Bifurcation diagram w.r.t. and corresponding time series plot.
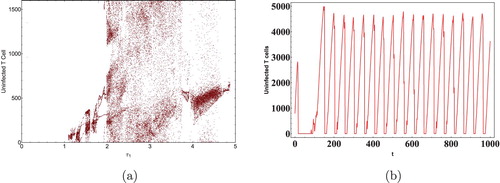
Figure 10. Bifurcation diagram w.r.t. and corresponding time series plot.