1,024
Views
4
CrossRef citations to date
0
Altmetric
Articles

A discrete host-parasitoid model with development of pesticide resistance and IPM strategies

, &
Pages 1059-1078 | Received 17 Apr 2018, Accepted 02 Dec 2018, Published online: 24 Dec 2018

Figures & data

Figure 1. The threshold values R¯0(k,q) and numerical simulations of model (Equation4) with constant pulse releasing of natural enemies. The baseline parameter values are as follows: ω0=0.99, RC=0.95, d1=0.8, q=3, a=1.6, b=0.001, α=2, β=0.1, d=0.6 and δc=0 (a) The plot of R¯0(k,q) with respect to k and δ=0.2; (b) The time series of the pest population associated with (a); (c) The plot of R¯0(k,q) with respect to k and the releasing constant δ determined by formula (Equation17); (d) The time series of the pest population associated with (c).

Figure 1. The threshold values R¯0(k,q) and numerical simulations of model (Equation4(4) Pt+1=aPt1+bPte−αNt,Nt+1=βPt1−e−αNt+dNt,t=1,2,…,ωqk=(1−d1)ωq(k−1)1−d1ωq(k−1),Pqk+=(1−d1ωqk)Pqk,Nqk+=Nqk+δk,k=1,2,…,(4) ) with constant pulse releasing of natural enemies. The baseline parameter values are as follows: ω0=0.99, RC=0.95, d1=0.8, q=3, a=1.6, b=0.001, α=2, β=0.1, d=0.6 and δc=0 (a) The plot of R¯0(k,q) with respect to k and δ=0.2; (b) The time series of the pest population associated with (a); (c) The plot of R¯0(k,q) with respect to k and the releasing constant δ determined by formula (Equation17(17) δ=δk=δc,if R1(k,q)≤RC,−1−dα1−d(k+1)qlnRCR1(k,q),if R1(k,q)>RC,(17) ); (d) The time series of the pest population associated with (c).

Figure 2. Bifurcation diagrams for model (Equation4) with different bifurcation parameters a,d,alpha, and δ. The baseline parameter values are as follows: d1=0.8, q=3, a=3.8, b=0.1,delta=0.1, β=0.4, d=0.1, α=2. (a) Bifurcation diagram for the density of the pest population with bifurcation parameter a; (b) Bifurcation diagram for the density of the pest population with bifurcation parameter d; (c) Bifurcation diagram for the density of the pest population with bifurcation parameter α; (d) Bifurcation diagram for the density of the pest population with bifurcation parameter δ.

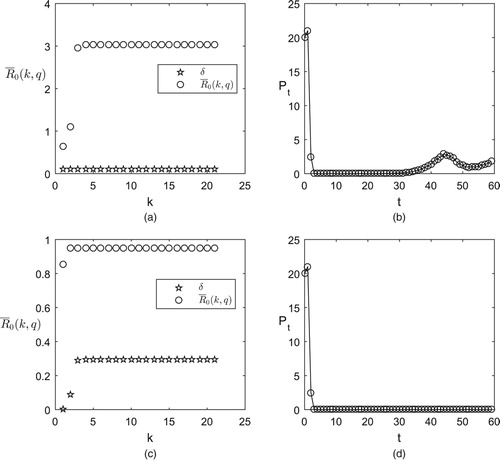
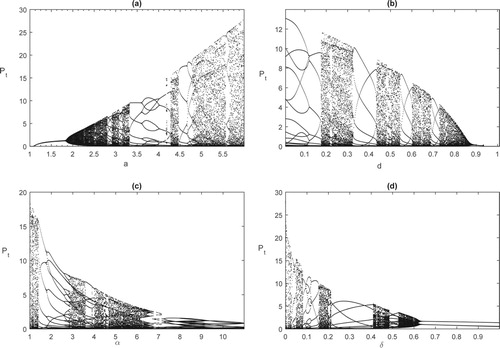
Figure 2. Bifurcation diagrams for model (Equation4(4) Pt+1=aPt1+bPte−αNt,Nt+1=βPt1−e−αNt+dNt,t=1,2,…,ωqk=(1−d1)ωq(k−1)1−d1ωq(k−1),Pqk+=(1−d1ωqk)Pqk,Nqk+=Nqk+δk,k=1,2,…,(4) ) with different bifurcation parameters a,d,alpha, and δ. The baseline parameter values are as follows: d1=0.8, q=3, a=3.8, b=0.1,delta=0.1, β=0.4, d=0.1, α=2. (a) Bifurcation diagram for the density of the pest population with bifurcation parameter a; (b) Bifurcation diagram for the density of the pest population with bifurcation parameter d; (c) Bifurcation diagram for the density of the pest population with bifurcation parameter α; (d) Bifurcation diagram for the density of the pest population with bifurcation parameter δ.