Figures & data
Figure 1. Schema of the compartmental model.
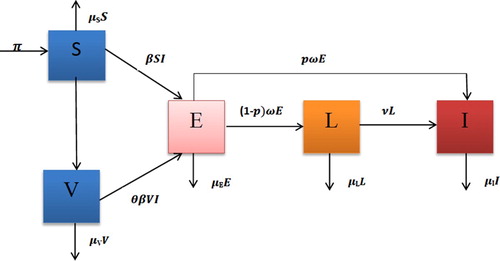
Table 1. Description of state variables and parameters of model (Equation1 (1) (1) ).
Figure 2. Sensitivity analysis between and each parameter.
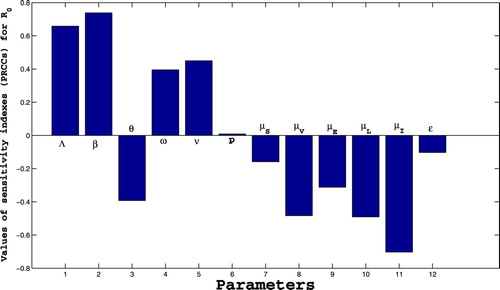
Table 2. Values and ranges of the parameters of model (Equation1(1) (1) ).
Figure 3. Simulation results showing the global stability of the DFE.
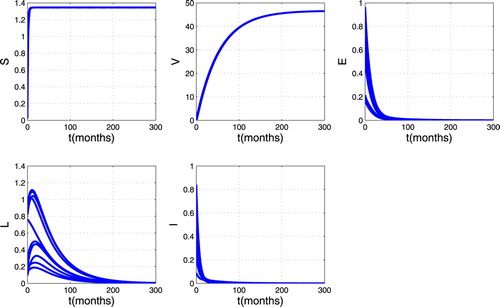
Figure 4. Simulation results showing the global stability of endemic equilibrium.
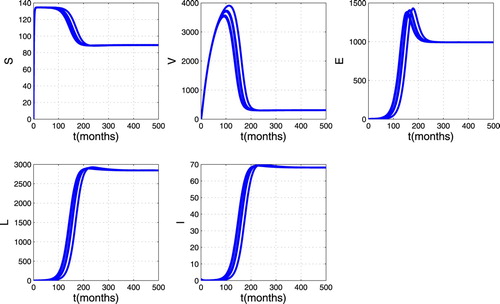
Figure 5. Impact of effective contact rate on the spread of TB.
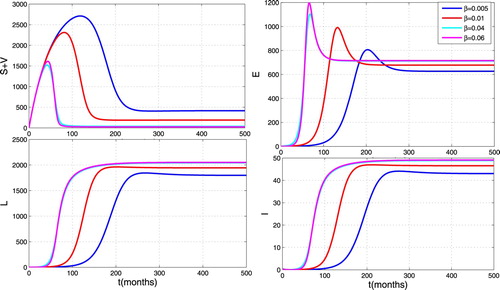
Figure 6. Impact of vaccination on the spread of TB.
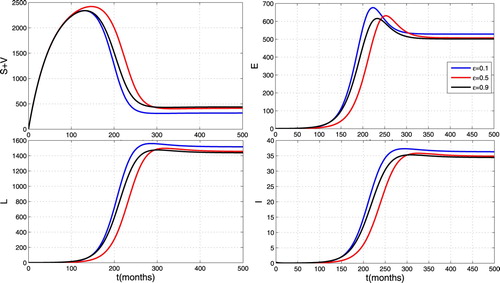
Figure 7. Impact of contact rate and vaccination coverage rate on the spread of TB.
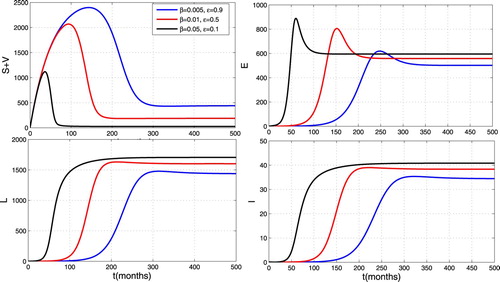
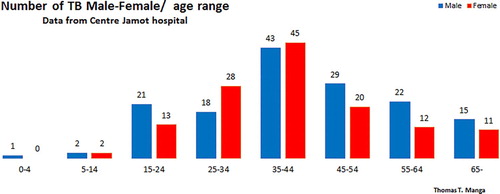
Figure 8. M/F age TB distribution.