Figures & data
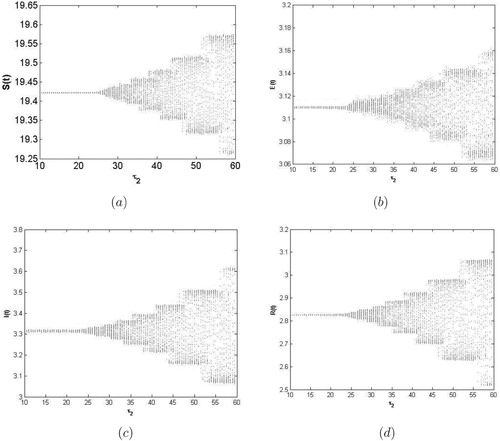
Figure 1. The bifurcation diagram with respect to when
.
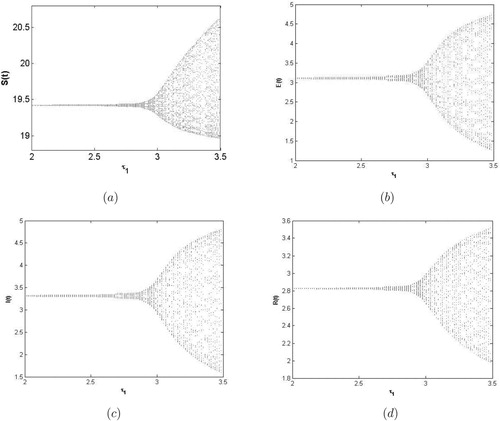
Figure 2. The bifurcation diagram with respect to when
.
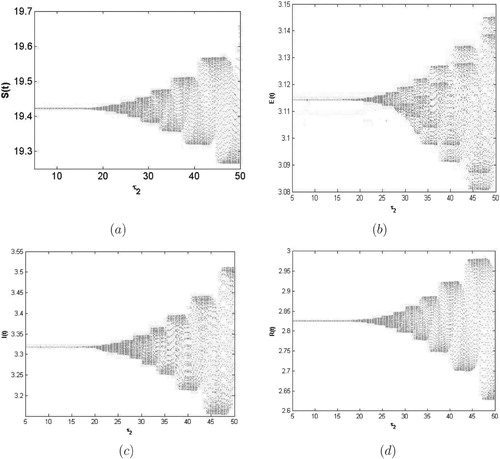
Figure 3. The bifurcation diagram with respect to τ when .
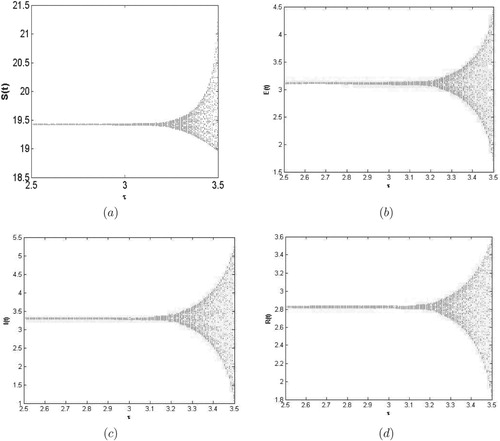
Figure 4. The bifurcation diagram with respect to when
and
.