Figures & data
Figure 1. Left: Figure shows two coexistence equilibria for some values of . Right: Areas of heroin dominance, HIV dominance, coexistence and bistable dominance. Parameter values in both figures are
,
,
,
,
,
,
,
.
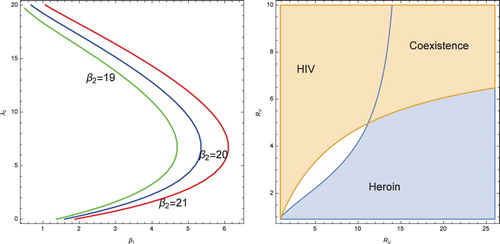
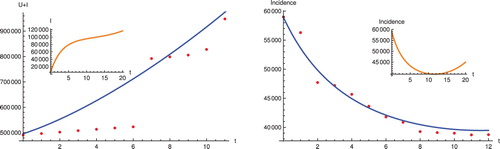
Figure 2. Left: Figure shows fitting of the heroin use data. Right: Figure shows fitting to HIV incidence data. In both figures time is in years where year t = 0 is year 2005. The preestimated and fitted parameters are given in Table 1.
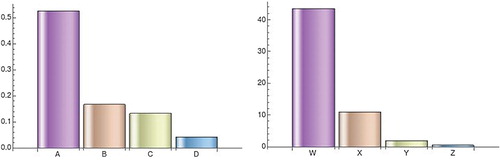
Table 1. Table of fixed and fitted parameter values.
Figure 3. Left: Figure shows elasticities of the invasion numbers with respect to the reproduction numbers. Right: Figure shows the elasticities of the invasion numbers with respect to q and σ. The parameters used are given in Table 1.