
Figures & data
Table 1. Value of model parameters.
Figure 1. The global stability of the boundary periodic solution of system (Equation2(2)
(2) ).
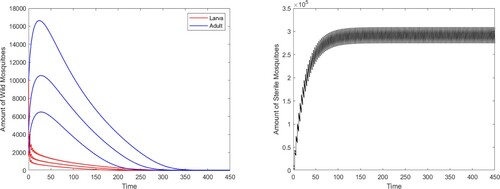
Figure 2. System (Equation2(2)
(2) ) has two locally stable periodic solutions with
: a positive coexistence one and a boundary one.
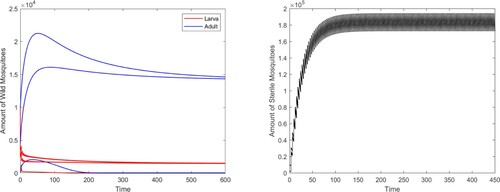
Figure 3. System (Equation2(2)
(2) ) has two locally stable periodic solutions with
: a positive coexistence one and a boundary one.
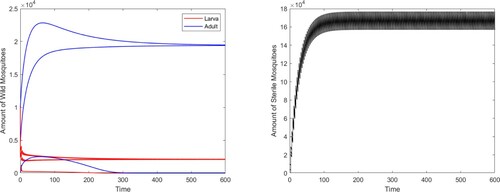
Figure 4. The global stability of the boundary periodic solution of system (Equation2(2)
(2) ) with
.
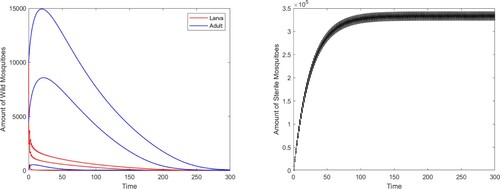
Figure 5. Release amount control: (a) Comparisons of total wild mosquitoes population under different biological controls; (b) Impact of the intensity of each release on the objective function and wild mosquito population at time T.
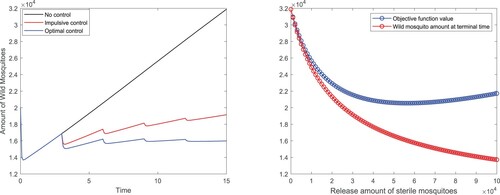
Figure 6. Release timing control: (a) Comparisons of total wild mosquitoes population under different biological controls; (b) Release strategy of the mixed optimal control; (c) Impact of the intensity of each release on the optimal cost value and wild mosquito population at time T; (d) Errors of the cost function in each iteration for optimal release timing control.
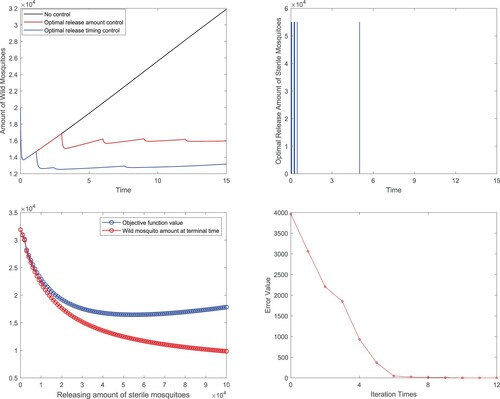
Table 2. Values of the cost function in the iteration process for optimal release timing control.
Figure 7. Mixed control: (a) Comparisons of total wild mosquitoes population under different biological controls; (b) Comparisons of total release amounts of sterile mosquitoes for three optimal control methods; (c) Release strategy of the mixed optimal control; (d) Errors of the cost function in each iteration for mixed optimal control.
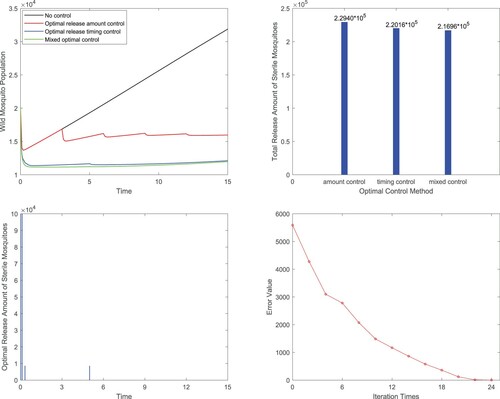
Table 3. Values of the cost function in the iteration process for optimal mixed control.
Table 4. Comparison of different release strategies.