
Figures & data
Figure 1. (Color online). Simulation of the SIR model showing the time-dependence of the S, I, and R compartments (left), for . The corresponding ICC curve is shown on the right. The exact expression given by Equation (Equation1
(1)
(1) ) is plotted as a solid black line; the numerically estimated ICC curve is shown as a thick cyan line.
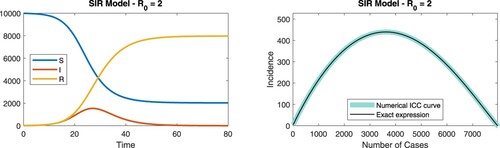
Figure 2. (Color online). Empirical ICC curves for two hypothetical outbreaks described by the SIR model with Poisson-distributed reporting noise. Incidence information is assumed to be available every , with
for
and
for
. In each panel, stars correspond to the simulated outbreak data plotted in the (C,
) plane. Data points without added noise (circles) and the exact ICC curve (solid line) are also shown.
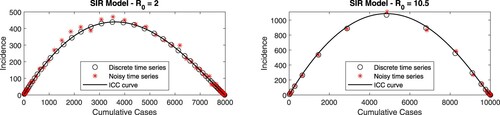
Figure 3. (Color online). Numerically estimated distributions of the parameter values ,
, and
for 100,000 outbreaks corresponding to noisy (Poisson-distributed) realizations of a reference outbreak with parameters
and
(
). Corresponding means and standard deviations are displayed in Table .
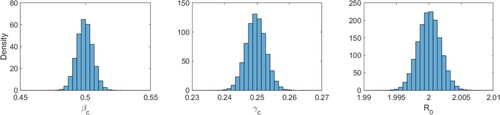
Figure 4. (Color online). Same as Figure , but with parameters and
(
). Corresponding means and standard deviations are displayed in Table .
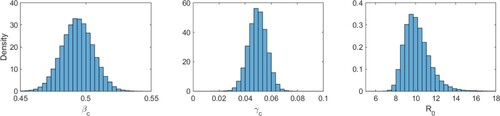
Table 1. Empirical mean (μ) and standard deviation (σ) of estimated parameter values in the presence of Poisson-distributed noise, for two values of .
Figure 5. (Color online). Similar to Figures (top row) and (bottom row) but for normally distributed noise of variable amplitude, set at 0.05, 0.15, or 0.25. Corresponding means and standard deviations are displayed in Table .
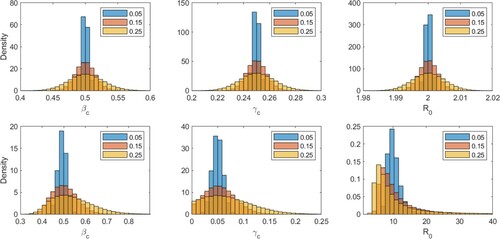
Table 2. Empirical mean (μ) and standard deviation (σ) of estimated parameter values in the presence of normally distributed noise of mean zero and amplitude ϵ, for two values of .
Figure 6. (Color online). Estimates of β, γ and as the outbreak unfolds for Poisson-distributed noise (left) and normally distributed noise of size 0.15 (right), in a situation where
. Estimates of
show the evolution of
(circles) and
(stars), where
indicates sample mean. Error bars correspond to one standard deviation on each side of the mean.
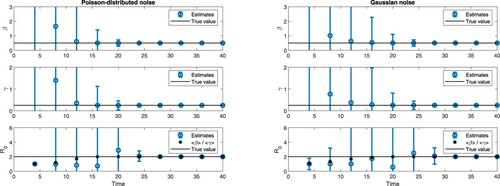
Figure 7. (Color online). Parameter estimates for a gastroenteritis outbreak in a nursing home in Mallorca, Spain [Citation12]. The top panel shows histograms (scaled to represent probability distributions) of ,
, and
, for
. The bottom panel shows the ICC curve for the optimal parameter values, corresponding to a value of
.
![Figure 7. (Color online). Parameter estimates for a gastroenteritis outbreak in a nursing home in Mallorca, Spain [Citation12]. The top panel shows histograms (scaled to represent probability distributions) of βc, γc, and R0, for N∈[93,186]. The bottom panel shows the ICC curve for the optimal parameter values, corresponding to a value of R0=1.52.](/cms/asset/f38680a9-c65e-4a34-b07e-e299f24ed33e/tjbd_a_1912419_f0007_oc.jpg)
Figure 8. (Color online). Optimal ICC curves and estimated distributions of values for early COVID-19 outbreaks in Hubei Province (top panel), the Republic of Korea (middle panel), and France (bottom panel).
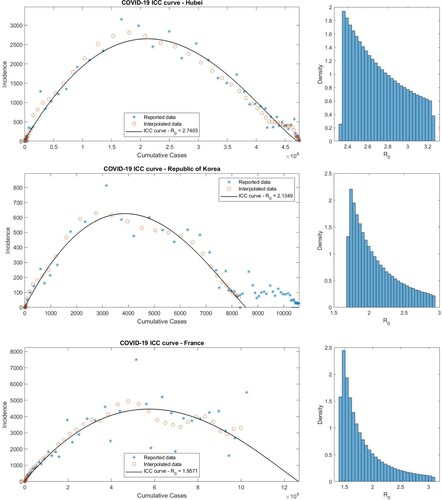
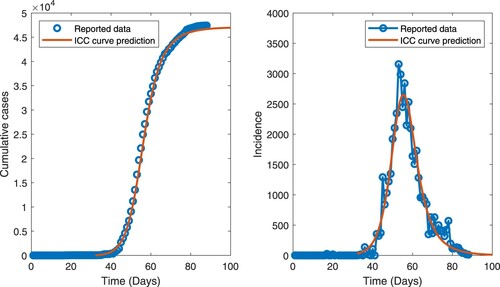
Figure 9. (Color online). Cumulative cases (left) and incidence (right) as functions of time for the COVID-19 outbreak in Hubei Province, China. The solid curves represent the predictions of the optimal ICC curve and the open circles are the data points. Time is measured in days from 14 December 2019 (day 0).
Supplemental Material
Download PDF (821.4 KB)Data availability statement
For codes and data sets used in this study, please see https://jocelinelega.github.io/EpiGro/.