1,594
Views
2
CrossRef citations to date
0
Altmetric
Research Article

A mathematical model for tilapia lake virus transmission with waning immunity

, &
Pages 98-116 | Received 27 Aug 2021, Accepted 19 Jan 2022, Published online: 07 Feb 2022

Figures & data

Table 1. Baseline values of the model parameters.
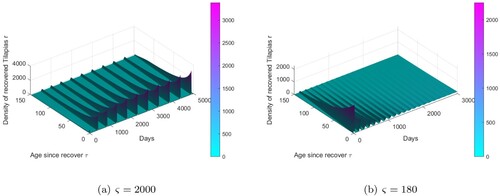
Figure 1. Results of simulations achieved with parameters in Table . The waning parameter γ is given in (Equation28) with the bifurcation parameter ς that varies. We show to simplify the graphical representations the quantities (Equation33) in (a,b). In 3D figures (c,d), we present the density of pathogen. We show the density of infected tilapias in 3D figures (e,f). (a) ς=2000. (b) ς=180. (c) ς=2000. (d) ς=180. (e) ς=2000. (f) ς=180.

Figure 1. Results of simulations achieved with parameters in Table 1. The waning parameter γ is given in (Equation28(28) γ(τ)={1ς−ς−1ςτifτ∈[0,ς],1ifτ∈[ς,+∞[.(28) ) with the bifurcation parameter ς that varies. We show to simplify the graphical representations the quantities (Equation33(33) I(t)=∫0∞i(a,t)daandR(t)=∫0∞r(τ,t)dτ.(33) ) in (a,b). In 3D figures (c,d), we present the density of pathogen. We show the density of infected tilapias in 3D figures (e,f). (a) ς=2000. (b) ς=180. (c) ς=2000. (d) ς=180. (e) ς=2000. (f) ς=180.

Figure 2. In 3D figures (a,b), we present the density of recovered tilapias. (a) ς=2000. (b) ς=180.

Figure 2. In 3D figures (a,b), we present the density of recovered tilapias. (a) ς=2000. (b) ς=180.