Figures & data
Figure 1. Malaria transmission dynamics with cross-border mobility. The upper SI-SIRS (inside red dashed line) and lower SI-SIRS (inside blue dashed line) represent the dynamics of malaria abroad and in the home country. The solid arrows represent the transfer of populations, and the dotted arrows represent the interaction between the susceptible human and infectious female Anopheles mosquitoes and infectious humans with susceptible female Anopheles mosquitoes. Here, subscripts H, A, and M refer to home, abroad, and migrant, respectively, and the subscript h and v refer to human and vector (mosquito), respectively.
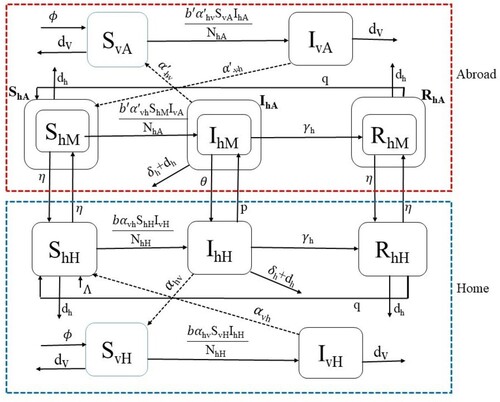
Figure 2. Model fitting to the data. (a) Solution of the fitted model along with the data of indigenous, imported, and total malaria incidences in Nepal, and (b) Model prediction of cumulative indigenous, cumulative imported, and cumulative total cases in Nepal.
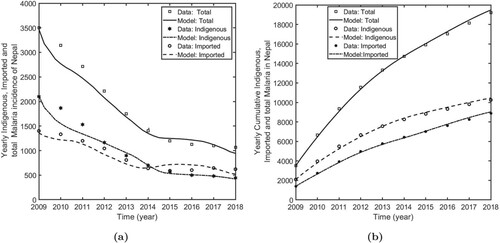
Figure 3. Endemic equilibriums. (a) Graphs of and
with possible three intersections corresponding to three endemic equilibrium points. (b) Graphs of
and
with exactly two endemic equilibrium points
and
. Decreasing the slope of
further gives only one equilibrium point
(a high epidemic level). (c) Graphs of
and
with exactly two endemic equilibrium points
and
. Increasing the slope of
further gives only one equilibrium point
(a low epidemic level).
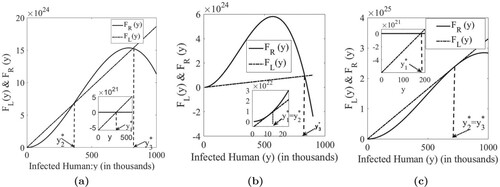
Table 1. Base value of demographic variables of malaria in Nepal.
Table 2. Model parameters of incidence of malaria in Nepal.
Figure 4. Model prediction of the malaria epidemic in Nepal. (a) The model prediction of the annual incidence of indigenous, imported, and total malaria cases from 2020 to 2026; and (b) the model prediction of the cumulative cases of indigenous, imported and total malaria infection from 2020 to 2026.
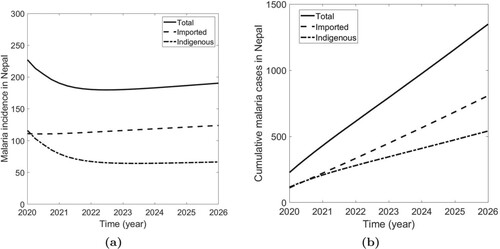
Figure 5. Impact of the API of India. Reduction of total malaria incidence at the year 2026 (Left) and reduction of cumulative malaria cases from 2020–2026 (Right) with Annual Parasitic Incidence (API) of India taking its value 0.1 for the base year 2020.
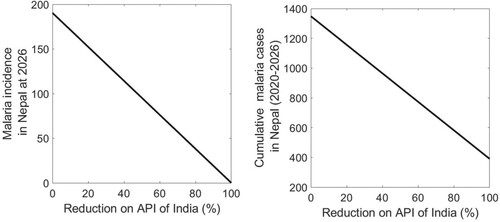
Figure 6. Condition for malaria elimination in Nepal. Threshold indices ,
,
,
,
,
as a function of controls
, and
for a low (first row) and high (second row) mosquito biting conditions. Note that the malaria is eliminated if
,
, and
, respectively, where
, and
are corresponding values of
for case I (absence of cross-border mobility), case II (full protection of transmission abroad), and case III (strict border screening and isolation), respectively.
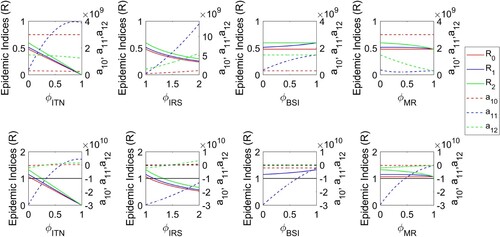
Figure 7. Effects of control strategies on the annual incidence rate. The model-predicted annual incidence rate in the year 2026 for various levels of ITN, IRS, BSI, and MR control in a low biting rate scenario (first row) and a high biting rate scenario (second row).
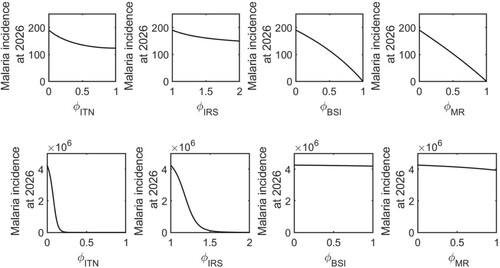
Figure 8. Effects of control strategies on the cumulative cases. The model-predicted cumulative cases for 2020–2026 for various levels of ITN, IRS, BSI, and MR control in a low biting rate scenario (first row) and a high biting rate scenario (second row).
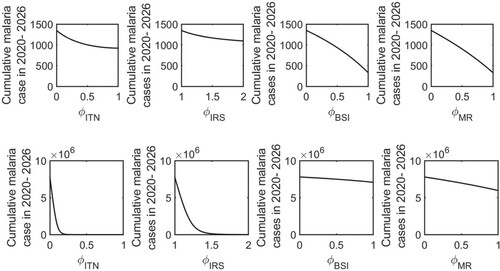
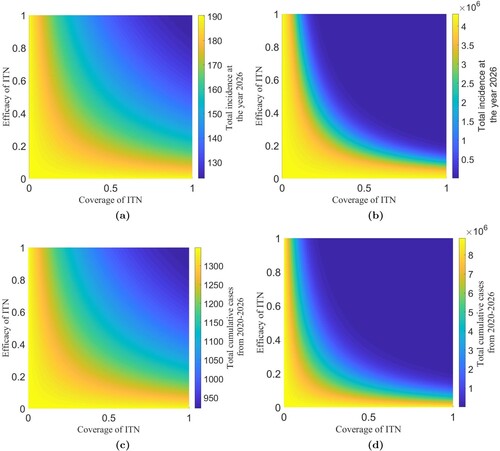
Figure 9. Sensitivity of coverage and efficacy of ITN. The model-predicted annual incidence rate in 2026 for various levels of efficacy and coverage of ITN in a low biting rate scenario (a) and a high biting rate scenario (b). The model-predicted cumulative cases for 2020–2026 for various levels of efficacy and coverage of ITN in a low biting rate scenario (c) and a high biting rate scenario (d).