
Figures & data
Table 1. The potential dynamical outcomes of system (Equation6(6)
(6) ).
Figure 1. The evolution of infection compartments of humans and mosquitoes when and
. (a) The evolution of
. (b) Then evolution of
. (c) Then evolution of
. (d) Then evolution of
.
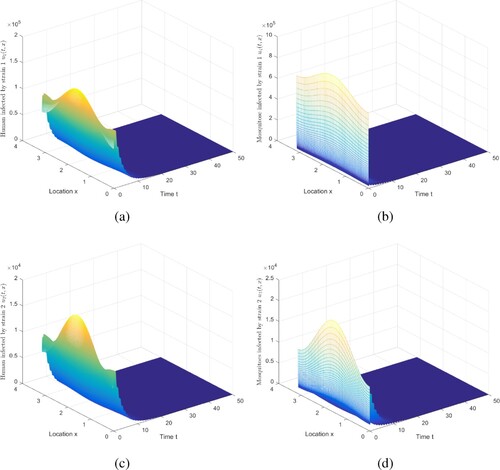
Figure 2. The evolution of infection compartments of humans and mosquitoes when and
. (a) The evolution of
. (b) The evolution of
. (c) The evolution of
. (d) The evolution of
.
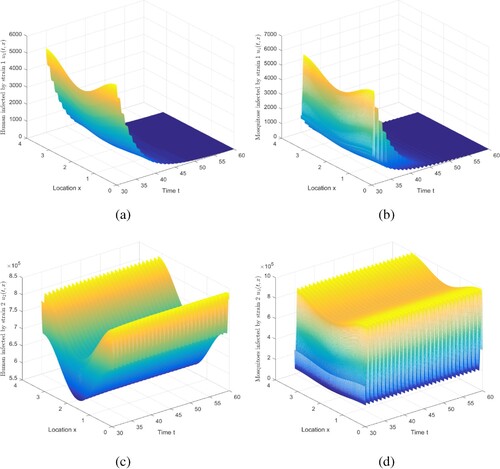
Figure 3. The evolution of infection compartments of humans and mosquitoes when and
. (a) The evolution of
. (b) Then evolution of
. (c) Then evolution of
. (d) Then evolution of
.
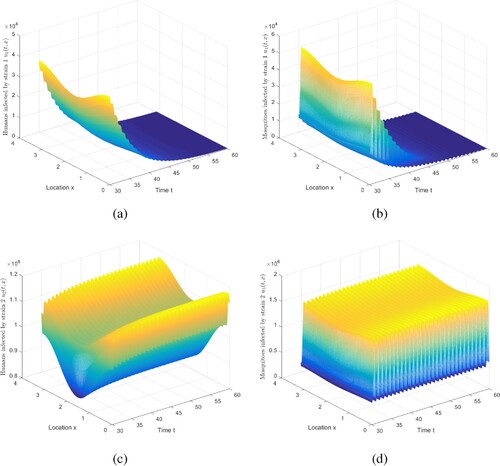
Figure 4. The evolution of infection compartments of humans and mosquitoes when and
. (a) The evolution of
. (b) The evolution of
. (c) The evolution of
. (d) The evolution of
.
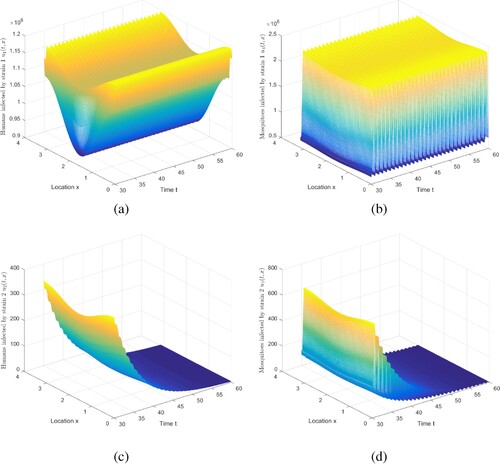
Figure 5. The evolution of infection compartments of humans and mosquitoes when and
. (a) The evolution of
. (b) The evolution of
. (c) The evolution of
. (d) The evolution of
.
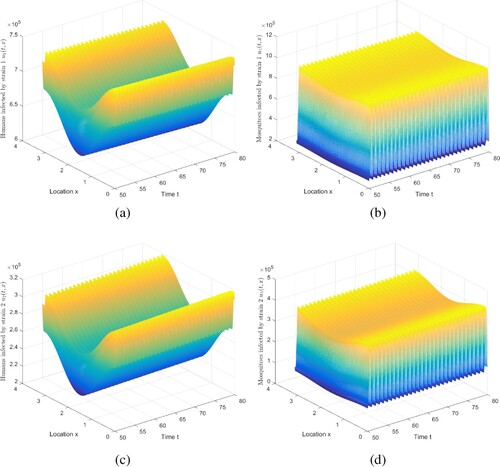
Figure 6. The evolution of infection compartments of humans and mosquitoes when and
. (a) The evolution of
. (b) The evolution of
. (c) The evolution of
. (d) The evolution of
.
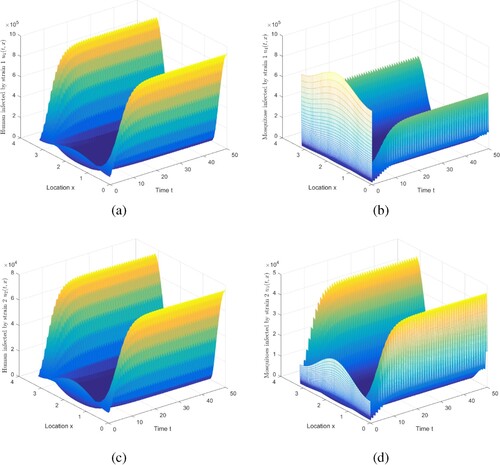
Figure 7. The evolution of infection compartments of humans and mosquitoes with and
. (a) The evolution of
. (b) The evolution of
. (c) The evolution of
. (d) The evolution of
.
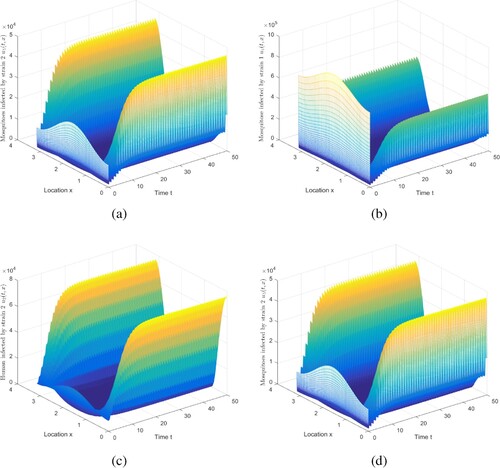
Figure 8. The evolution of infection compartments of humans and mosquitoes with and
. (a) The evolution of
. (b) The evolution of
. (c) The evolution of
. (d) The evolution of
.
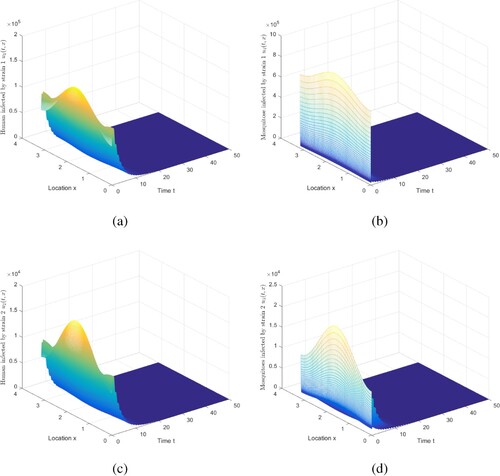
Figure 9. Increasing medical resources in the environment of spatial heterogeneity and its influence on the .
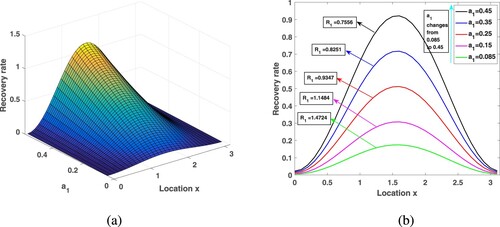
Figure 10. For fixed medical resources, the spatial distribution of and the corresponding value of
.
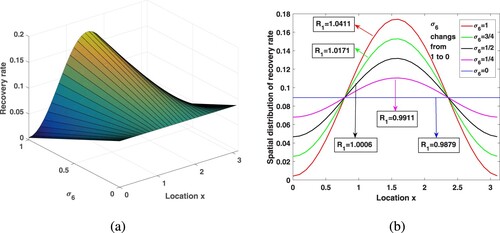
Figure 11. The evolution of infection compartments of humans and mosquitoes with different vector-bias parameter. Among them, green indicates that there is a vector-bias effect (), and red indicates that there is no vector-bias effect (
). (a) With vector-bias effect. (b) Without vector-bias effect. (c) With vector-bias effect. (d) Without vector-bias effect.
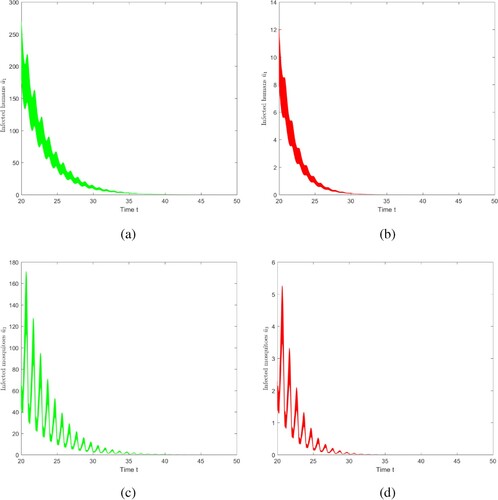
Figure 12. The evolution infection compartments of humans and mosquitoes with seasonal temperature changes and without seasonal temperature changes. Among them, red indicates that the parameters depend on temperature, and green indicates that the parameters do not depend on temperature.
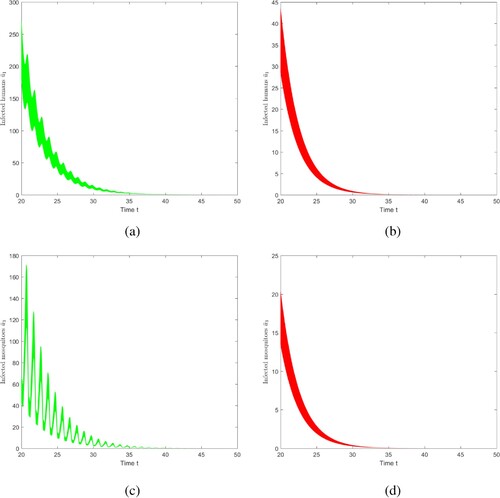
Figure A1. A small interval of development level of infection.
Figure A2. The parameters change with time. (a) Change of contact rate with time. (b) Change of EIP
with time. (c) Change of the death rate of mosquitoes
with time.
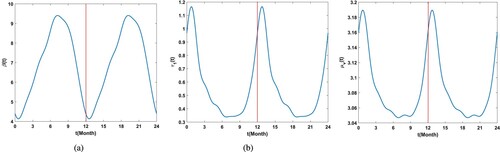
Table F1. Definition and value of parameters.