
Figures & data
Figure 1. Schematic representation of the virus transport in peristaltic flow medium.
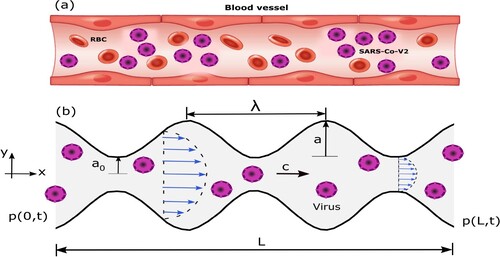
Table 1. Specifications of viruses based on literature.
Table 2. Values of basic parameters used in the simulation [Citation18, Citation19, Citation23].
Table 3. Computed values of Stokes number, density ratio, and gravity of the viruses as well as the estimated values of coefficients of Stokes drag and Virtual mass.
Figure 2. Contour lines that represent the axial velocity field for the background flow with different viscosity (a) , (b)
at fixed value of
.
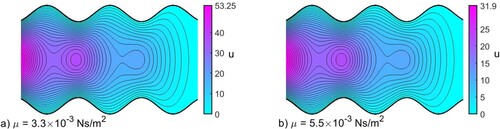
Figure 3. Combined effects of Stokes drag, virtual mass-1, Basset and gravity on (a) SARS-CoV-2 and (b) Influenza-A virus velocities.
Figure 4. The streamlines of the (a) SARS-CoV-2 and (b) Influenza virus in the bloodstream with the Combined effects of Stokes drag, virtual mass-1, Basset, and gravity.
Figure 5. Contour plots of axial velocity components for (a) SARS-CoV-2 (b) Influenza-A in the presence of Stokes drag force.
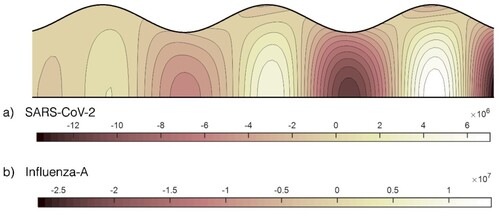
Figure 6. Contour plots of axial velocity components for (a) SARS-CoV-2 (b) Influenza-A in the presence of Basset force.
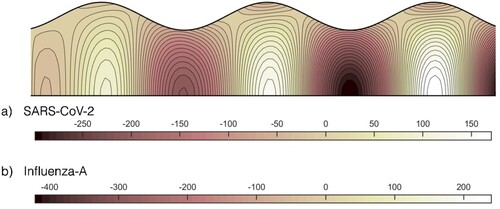
Figure 7. The normalized axial velocity with time for Influenza-A and SARS-CoV-2 with the combined effect of all forces.
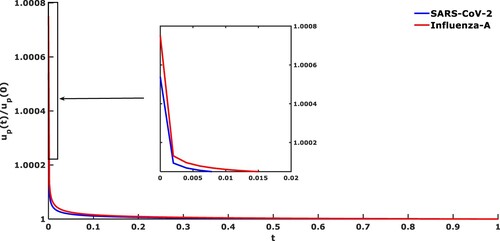
Figure 8. Effect of Stokes drag on spherical and non-spherical particle of coronavirus virus in axial and transverse particle velocity.
Figure 9. Effect of blood viscosity of coronavirus in (a) axial and (b) transverse particle velocity.
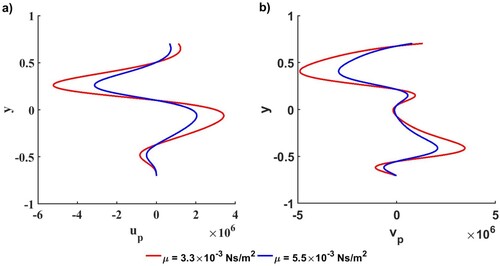
Figure 10. Contour plots of the axial particle velocity of Coronavirus for (a) (b)
.
Data Availability
The data that supports the findings of this study are available within the article.