Figures & data
Figure 1. Flow diagram reflecting infection dynamics for groups 1 and 2, interconnected by the infection rates via the weighted average proportion of contacts made with infectives, .
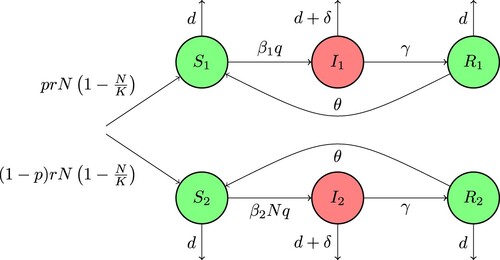
Table 1. State variable and parameter definitions and their units.
Table 2. Summary of estimated model parameters.
Figure 2. The basic reproduction number as a function of p for high (Buraydah, solid curve) and low (Ash Shimasiyah, dashed curve) values of
.
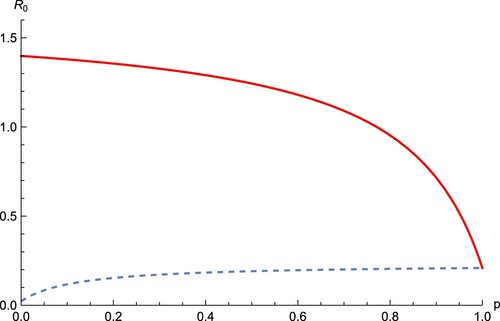
Figure 3. Variation in as a function of p and
, using
/day,
/day.
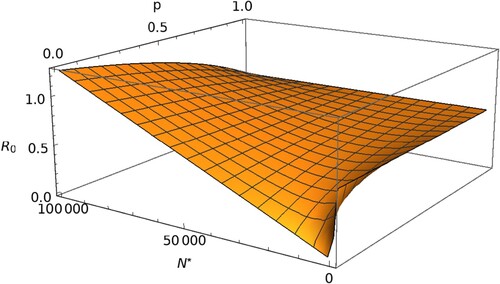
Figure 4. Effects of population density on
for different values of p.
as in Figure .
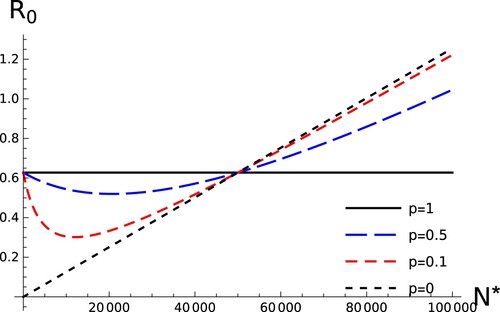
Figure 5. The population size which minimizes , as a function of p.
as in Figure .
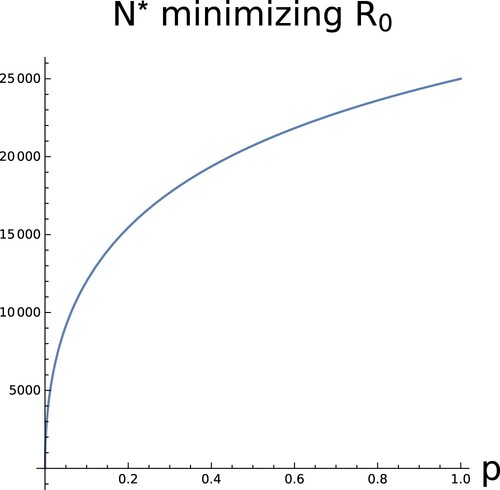
Figure 6. Variation in as a function of p and
, using
/day,
/day.
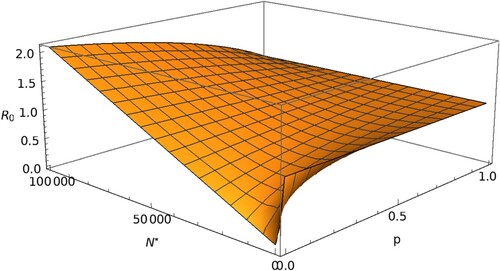
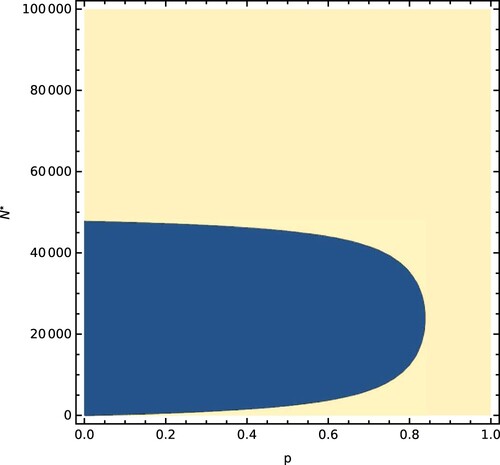
Figure 7. The dark shaded region shows combinations of p and for which
, using
/day,
/day.