Figures & data
Figure 1. Framework of COVID-19 model.
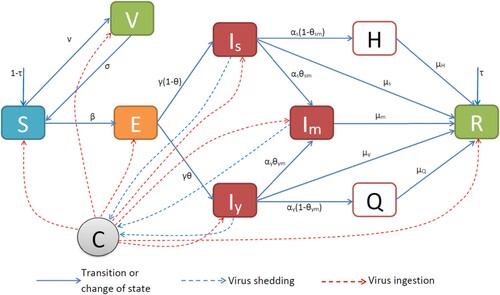
Table 1. Variables of the model.
Table 2. Baseline values for the model parameters.
Table
Figure 2. COVID-19 in Cameroon and New York State (U.S.A.): Model results vs data. (A) 30-day rolling number of COVID-19 new infection cases in Cameroon between 17 June and 25 September 2021: N=28 million, RE=6.44%, ; (B) Daily number of COVID-19 new infection cases in New York State between 17 June and 16 August 2021: N=20 million, RE=4.3%,
. The parameter values are in Table .
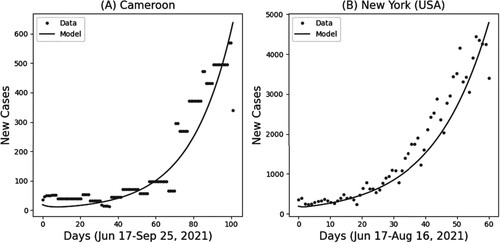
Figure 3. Parameter sensitivity analysis for the severity of COVID-19 in Cameroon (Jun 17-Sep 25, 2021) and New York State (Jun 17-Aug 16, 2021). All the parameters have p-values except
whose p-value is
; we exclude it from the analysis. (a) Cameroon and (b) New York State (U.S.A.).
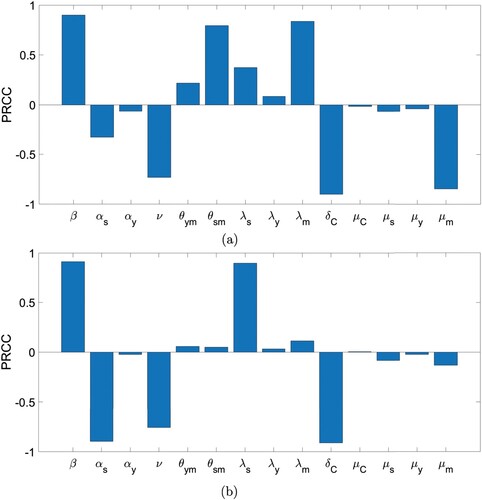
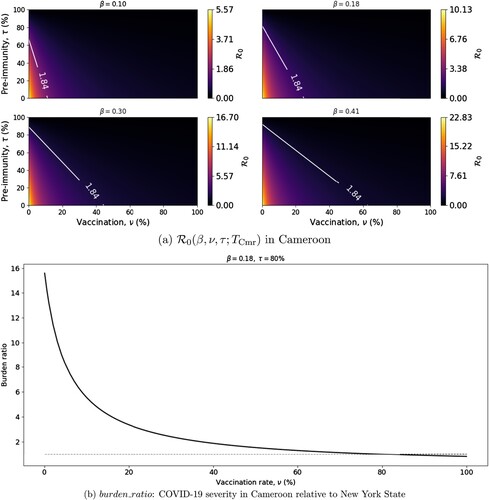
Figure 4. Values of in Cameroon and
relative to New York State. (a)
increases with β and decreases with ν and τ. (b)
decreases exponentially with
when
, and
when
. The dashed line represents
. All other parameters are listed in Table . (a)
in Cameroon and (b)
: COVID-19 severity in Cameroon relative to New York State.