Figures & data
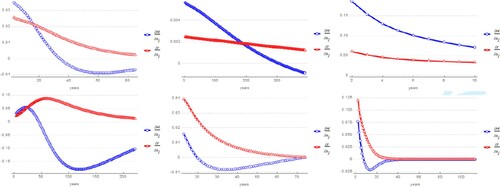
Figure 1. Sensitivity of r (red) and H (blue) with respect to , left to right: H. sapiens (Japanese)
, H. sapiens (Swedish)
, L. rothschildi
, P. reticulata
, H. sapiens (hunter gatherers)
, and F. glacialoides
.
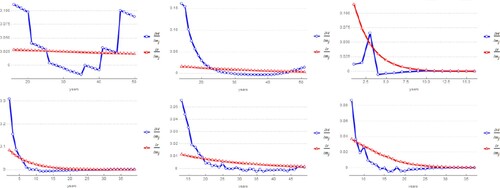
Figure 2. Sensitivity of r and H : O. orca
, D. longispina
, P. leo
, P. cynocephalus
, M. quadricornifera
and C. capreolus
.
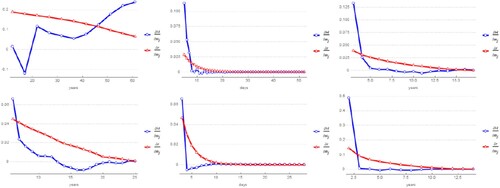
Figure 3. Sensitivity of r and H : C. elaphus
, C. elegans
, P. humanus
, P. troglodytes
, D. melanogaster
and R. rupicapra
.
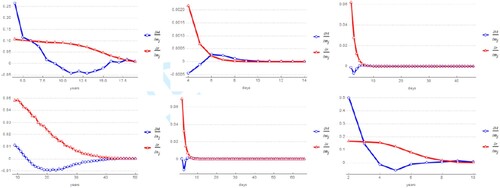
Figure 4. Sensitivity of r and H : O. aries
, C. capitata
, A. melbus
, C. olor
, M. oeconomus
and H. cumulicola
.
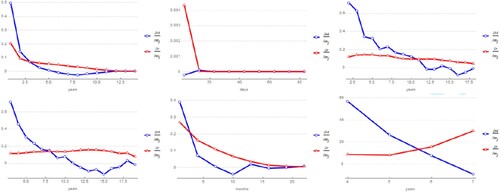
Figure 5. Sensitivity of r and H : P. sylvestris
, C. johnsoni
, M. flaviventris
, A. nisus
, C. flava
and A. marmorata
.
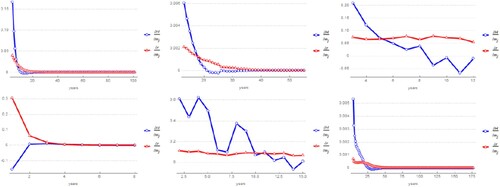
Figure 6. Sensitivity of r and H : G. orbignyan
, L. vivipara
, U. minor
, B. pyrenaica
, F. albicollis
and R. maximum
.
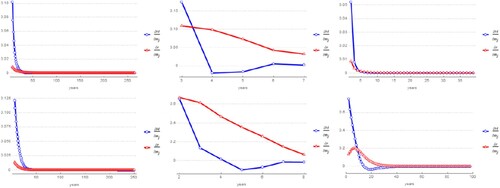
Figure 7. Sensitivity of r and H : P. major
, H. magnipapillata
, P. longicarpus
, A. acanthocarpa
, H. rufescens
and R. aurora
.
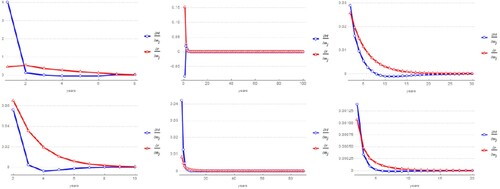
Table 1. Population dynamics: comparison of and H of 48 species.
Figure 8. Sensitivity of r and H : P. clavata
, V. furcatum
, L. digitata
, Q. rugosa
, G. agassizii
and A. marina
.
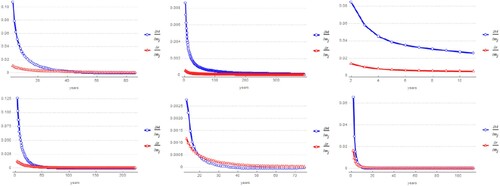
Figure 9. Sensitivity of r (red) and H (blue) with respect to , left to right: H. sapiens (Japanese)
, H. sapiens (Swedish)
, L. rothschildi
, P. reticulata
, H. sapiens (hunter gatherers)
, and F. glacialoides
.
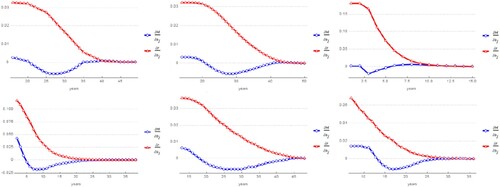
Figure 10. Sensitivity of r and H : O. orca
, D. longispina
, P. leo
, P. cynocephalus
, M. quadricornifera
and C. capreolus
.
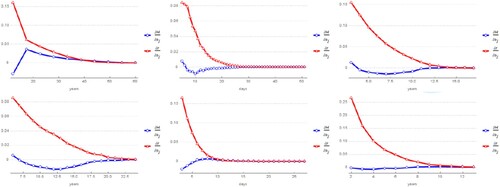
Figure 11. Sensitivity of r and H : C. elaphus
, C. elegans
, P. humanus
, P. troglodytes
, D. melanogaster
and R. rupicapra
.
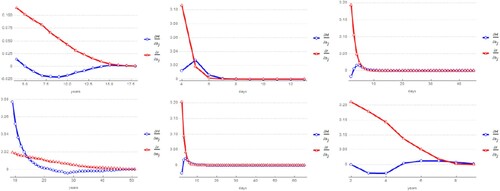
Figure 12. Sensitivity of r and H : O. aries
, C. capitata
, A. melbus
, C. olor
, M. oeconomus
and H. cumulicola
.
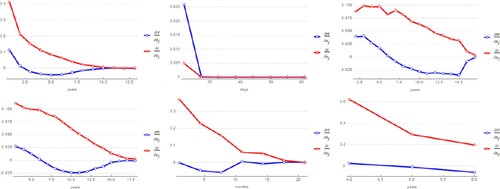
Figure 13. Sensitivity of r and H : P. sylvestris
, C. johnsoni
, M. flaviventris
, A. nisus
, C. flava
and A. marmorata
.
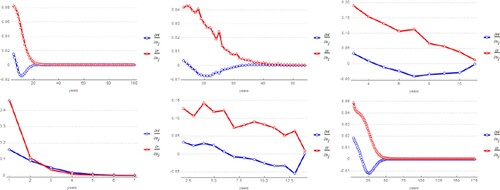
Figure 14. Sensitivity of r and H : G. orbignyan
, L. vivipara
, U. minor
, B. pyrenaica
, F. albicollis
and R. maximum
.
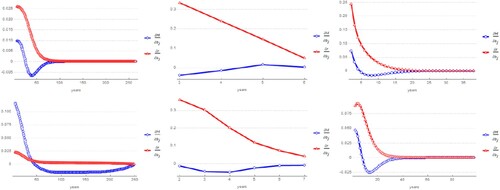
Figure 15. Sensitivity of r and H : P. major
, H. magnipapillata
, P. longicarpus
, A. acanthocarpa
, H. rufescens
and R. aurora
.
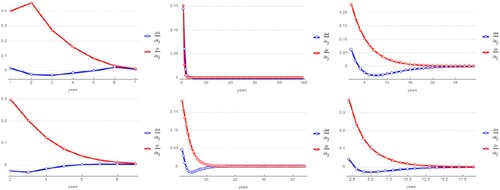
Figure 16. Sensitivity of r and H : P. clavata
, V. furcatum
, L. digitata
, Q. rugosa
, G. agassizii
and A. marina
.