Figures & data
Figure 1. Local activation via positive feedback and depletion of the substrate in the cytosol generates an activator-enriched domain on the cortex [Citation3].
![Figure 1. Local activation via positive feedback and depletion of the substrate in the cytosol generates an activator-enriched domain on the cortex [Citation3].](/cms/asset/8e63e858-6f6e-4f6d-bbea-992516778770/tjbd_a_2260833_f0001_oc.jpg)
Figure 2. The interconversion of Rho-GTPases between active and inactive forms can be modelled as a reaction–diffusion equation governing the dynamics of the slowly-diffusing activator u and the infinitely-diffusing substrate v.
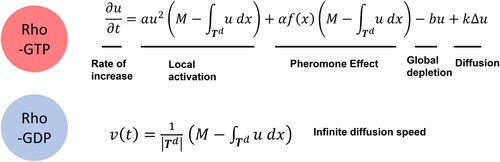
Figure 3. Derivation of a pheromone profile generated from a heat equation.
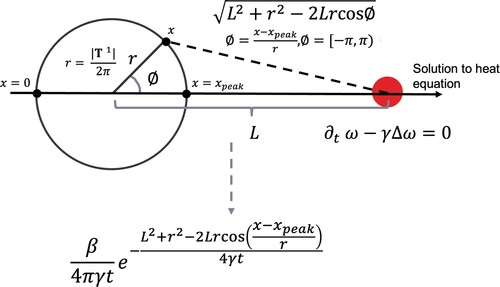
Figure 4. Pheromone profile generated from a heat equation and a similar linear pheromone profile
.
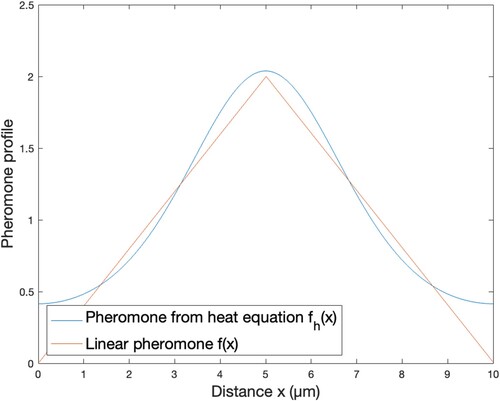
Table 1. Parameters from [Citation3].
Figure 5. Numeric solution to Equation (Equation7(7)
(7) ) with α = 2 and other parameters given in Table : (a) pheromone profile given by
and (b) pheromone profile given by
.
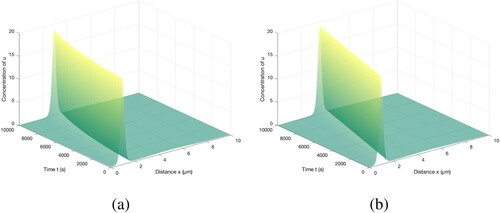
Figure 6. Movement speed as a function of pheromone profile slope
.
for
.
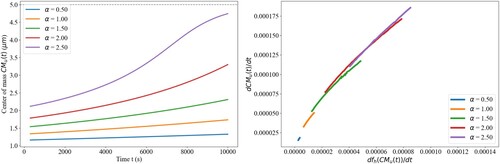
Figure 7. Movement speed as a function of pheromone profile slope
.
is a constant for
.
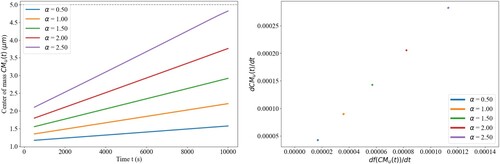
Figure 8. Initial profile for rho-GTPase u, rho-GDPase v, and pheromone profile and pheromone strength
: (a) initial profile t = 0s and (b) profile when
.
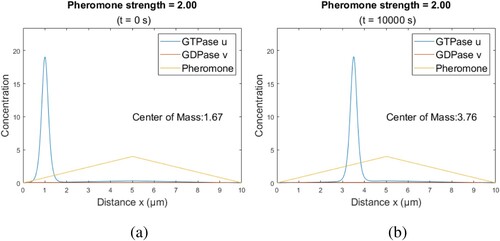
Figure 9. Centre of mass position as a function of time with pheromone profile
. In regions away from
,
changes linearly with time.
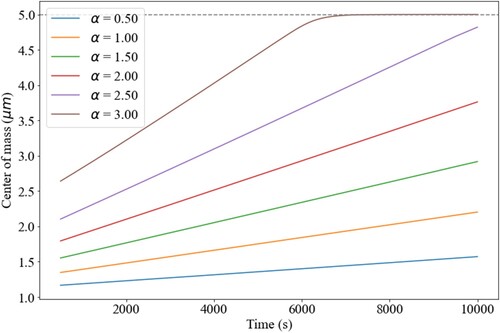
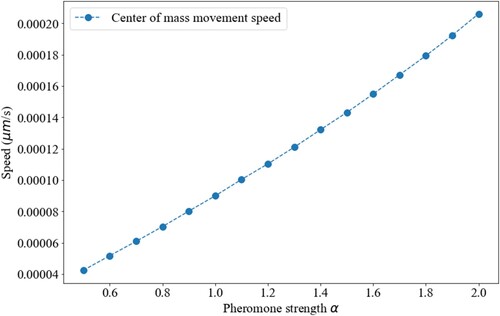
Figure 10. Centre of mass movement speed as a function of pheromone strength α with pheromone profile
. In regions away from
,
changes linearly with α.