Figures & data
Table 1. Total protein, albumin, and globulin levels in individuals with and without HIV infection.
Figure 1. Schematic diagram of the within-host model. CD4 T cells are denoted by T, infected cells are denoted by , the virus is denoted by V , CD8 T cells are denoted by Z and nutrition (protein) is denoted by η.
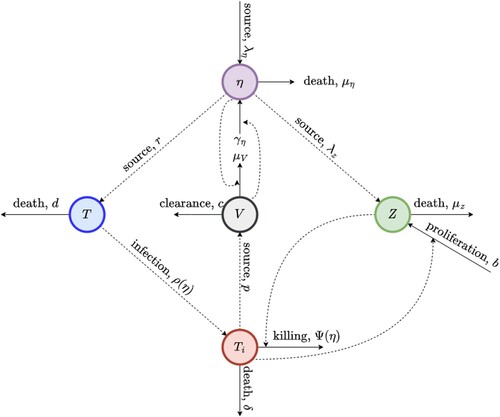
Table 2. Brief descriptions of the parameters of the within-host model together with the numerical values and units of the parameters and initial conditions.
Figure 2. Graphical representation of inequality (Equation14(14)
(14) ).
![Figure 2. Graphical representation of inequality (Equation14(14) pμZ(μη−γηV∗)>bV∗[c(μη−γηV∗)+λημV]⇔bλημVV∗<(μη−γηV∗)(pμZ−bcV∗).(14) ).](/cms/asset/50d3aa89-af00-4402-b3d2-769b8a826c3c/tjbd_a_2287087_f0002_oc.jpg)
Figure 3. The impact of the viral production rate (p) on (a) the viral load and (b) total protein. (a) Simulations of the model (Equation1(1)
(1) ) depicting the impact of the viral production rate (p) on the viral load. The other parameters used for the simulations are presented in Table . (b) Simulations of the model (Equation1
(1)
(1) ) depicting the impact of the viral production rate (p) on total protein. The other parameters used for the simulations are presented in Table .
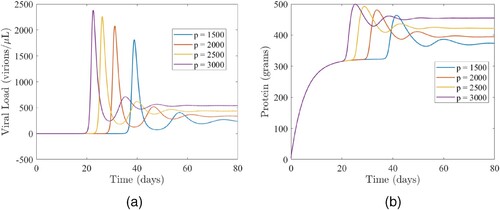
Figure 4. The impact of the protein intake () on (a) the viral load and (b) total protein. (a) Simulations of the model (Equation1
(1)
(1) ) depicting the impact of the protein intake (
) on the viral load. The other parameters used for the simulations are presented in Table . (b) Simulations of the model (Equation1
(1)
(1) ) depicting the impact of the protein intake (
) on total protein. The other parameters used for the simulations are presented in Table .
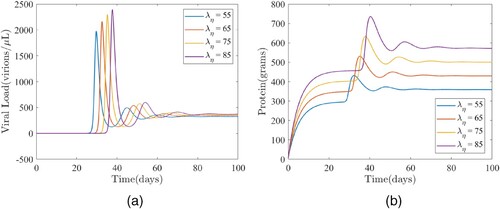
Figure 5. (a) The impact of the protein intake () on the viral load and (b) the dynamics of the viral load (V) and total protein (η). (a) Simulations of the model (Equation1
(1)
(1) ) illustrating the impact of the protein intake rate (
) on viral load. For these simulations,
, and the other parameter values are as given in Table . (b) Simulations of the model (Equation1
(1)
(1) ) illustrating the dynamics of the viral load (V) and total protein (η). Parameter values are as fixed at their baseline values given in Table .
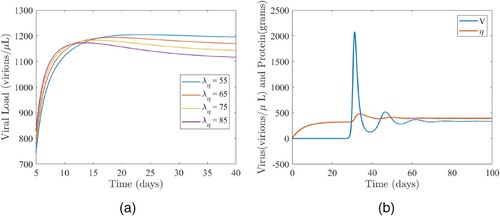
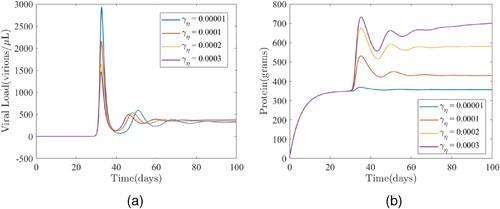
Figure 6. The impact of the protein intake () on (a) the viral load and (b) total protein. (a) Time series plot of the model (Equation1
(1)
(1) ) showing the effects of the enhancement rate of protein by the virus (
) on the viral load (V). The values of the other parameter used for the simulations are as given in Table . (b) Time series plot of the model (Equation1
(1)
(1) ) showing the effects of the enhancement rate of protein by the virus (
) on the total protein level (η). The values of the other parameter used for the simulations are as given in Table .